- Page 1 and 2:
24 th ANNUAL AUSTRALIAN POULTRY SCI
- Page 3 and 4:
AUSTRALIAN POULTRY SCIENCE SYMPOSIU
- Page 5:
AUSTRALIAN POULTRY AWARD The Austra
- Page 9 and 10:
CONTENTS THE IMPORTANCE OF THE POUL
- Page 11 and 12:
SHORT COMMUNICATION SESSION # 1: (c
- Page 13 and 14:
SHORT COMMUNICATION SESSTION # 2: (
- Page 15:
HOT TOPIC 2: EMERGING DISEASES AND
- Page 18 and 19:
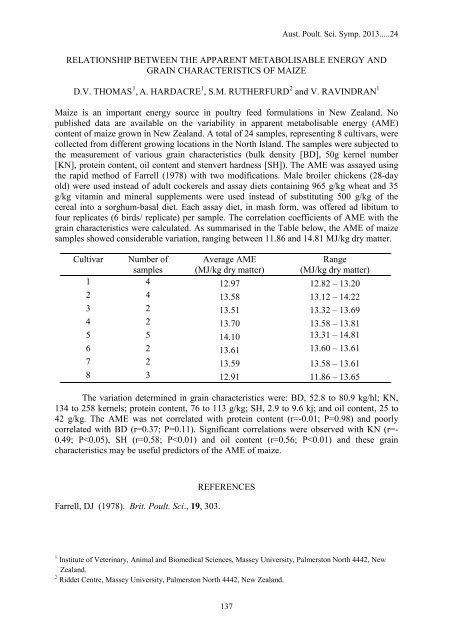
Aust. Poult. Sci. Symp. 2013.....24
- Page 20 and 21:
Aust. Poult. Sci. Symp. 2013.....24
- Page 22 and 23:
Aust. Poult. Sci. Symp. 2013.....24
- Page 24 and 25:
Aust. Poult. Sci. Symp. 2013.....24
- Page 26 and 27:
Aust. Poult. Sci. Symp. 2013.....24
- Page 28 and 29:
Aust. Poult. Sci. Symp. 2013.....24
- Page 30 and 31:
Aust. Poult. Sci. Symp. 2013.....24
- Page 32 and 33:
Aust. Poult. Sci. Symp. 2013.....24
- Page 34 and 35:
Aust. Poult. Sci. Symp. 2013.....24
- Page 36 and 37:
Aust. Poult. Sci. Symp. 2013.....24
- Page 38 and 39:
Aust. Poult. Sci. Symp. 2013.....24
- Page 40 and 41:
Aust. Poult. Sci. Symp. 2013.....24
- Page 42 and 43:
Aust. Poult. Sci. Symp. 2013.....24
- Page 44 and 45:
Aust. Poult. Sci. Symp. 2013.....24
- Page 46 and 47:
Aust. Poult. Sci. Symp. 2013.....24
- Page 48 and 49:
Aust. Poult. Sci. Symp. 2013.....24
- Page 50 and 51:
Aust. Poult. Sci. Symp. 2013.....24
- Page 52 and 53:
Aust. Poult. Sci. Symp. 2013.....24
- Page 54 and 55:
Aust. Poult. Sci. Symp. 2013.....24
- Page 56 and 57:
Aust. Poult. Sci. Symp. 2013.....24
- Page 58 and 59:
Aust. Poult. Sci. Symp. 2013.....24
- Page 60 and 61:
Aust. Poult. Sci. Symp. 2013.....24
- Page 62 and 63:
Aust. Poult. Sci. Symp. 2013.....24
- Page 64 and 65:
Aust. Poult. Sci. Symp. 2013.....24
- Page 66 and 67:
Aust. Poult. Sci. Symp. 2013.....24
- Page 68 and 69:
Aust. Poult. Sci. Symp. 2013.....24
- Page 70 and 71:
Aust. Poult. Sci. Symp. 2013.....24
- Page 72 and 73:
Aust. Poult. Sci. Symp. 2013.....24
- Page 74 and 75:
Aust. Poult. Sci. Symp. 2013.....24
- Page 76 and 77:
Aust. Poult. Sci. Symp. 2013.....24
- Page 78 and 79:
Aust. Poult. Sci. Symp. 2013.....24
- Page 80 and 81:
Aust. Poult. Sci. Symp. 2013.....24
- Page 82 and 83:
Aust. Poult. Sci. Symp. 2013.....24
- Page 84 and 85:
Aust. Poult. Sci. Symp. 2013.....24
- Page 86 and 87:
Aust. Poult. Sci. Symp. 2013.....24
- Page 88 and 89:
Aust. Poult. Sci. Symp. 2013.....24
- Page 90 and 91:
Aust. Poult. Sci. Symp. 2013.....24
- Page 92 and 93:
Aust. Poult. Sci. Symp. 2013.....24
- Page 94 and 95:
Aust. Poult. Sci. Symp. 2013.....24
- Page 96 and 97:
Aust. Poult. Sci. Symp. 2013.....24
- Page 98 and 99:
Aust. Poult. Sci. Symp. 2013.....24
- Page 100 and 101:
Aust. Poult. Sci. Symp. 2013.....24
- Page 102 and 103: Aust. Poult. Sci. Symp. 2013.....24
- Page 104 and 105: Aust. Poult. Sci. Symp. 2013.....24
- Page 106 and 107: Aust. Poult. Sci. Symp. 2013.....24
- Page 108 and 109: Aust. Poult. Sci. Symp. 2013.....24
- Page 110 and 111: Aust. Poult. Sci. Symp. 2013.....24
- Page 112 and 113: Aust. Poult. Sci. Symp. 2013.....24
- Page 114 and 115: Aust. Poult. Sci. Symp. 2013.....24
- Page 116 and 117: Aust. Poult. Sci. Symp. 2013.....24
- Page 118 and 119: Aust. Poult. Sci. Symp. 2013.....24
- Page 120 and 121: Aust. Poult. Sci. Symp. 2013.....24
- Page 122 and 123: Aust. Poult. Sci. Symp. 2013.....24
- Page 124 and 125: Aust. Poult. Sci. Symp. 2013.....24
- Page 126 and 127: Aust. Poult. Sci. Symp. 2013.....24
- Page 128 and 129: Aust. Poult. Sci. Symp. 2013.....24
- Page 130 and 131: Aust. Poult. Sci. Symp. 2013.....24
- Page 132 and 133: Aust. Poult. Sci. Symp. 2013.....24
- Page 134 and 135: Aust. Poult. Sci. Symp. 2013.....24
- Page 136 and 137: Aust. Poult. Sci. Symp. 2013.....24
- Page 138 and 139: Aust. Poult. Sci. Symp. 2013.....24
- Page 140 and 141: Aust. Poult. Sci. Symp. 2013.....24
- Page 142 and 143: Aust. Poult. Sci. Symp. 2013.....24
- Page 144 and 145: Aust. Poult. Sci. Symp. 2013.....24
- Page 146 and 147: Aust. Poult. Sci. Symp. 2013.....24
- Page 148 and 149: INTERACTIVE EFFECTS OF EXOGENOUS EN
- Page 150 and 151: microbiota to favor an increased ac
- Page 154 and 155: Aust. Poult. Sci. Symp. 2013.....24
- Page 156 and 157: Aust. Poult. Sci. Symp. 2013.....24
- Page 158 and 159: Aust. Poult. Sci. Symp. 2013.....24
- Page 160 and 161: Aust. Poult. Sci. Symp. 2013.....24
- Page 162 and 163: Aust. Poult. Sci. Symp. 2013.....24
- Page 164 and 165: Aust. Poult. Sci. Symp. 2013.....24
- Page 166 and 167: Aust. Poult. Sci. Symp. 2013.....24
- Page 168 and 169: Aust. Poult. Sci. Symp. 2013.....24
- Page 170 and 171: Aust. Poult. Sci. Symp. 2013.....24
- Page 172 and 173: Aust. Poult. Sci. Symp. 2013.....24
- Page 174 and 175: Aust. Poult. Sci. Symp. 2013.....24
- Page 176 and 177: Aust. Poult. Sci. Symp. 2013.....24
- Page 178 and 179: Aust. Poult. Sci. Symp. 2013.....24
- Page 180 and 181: Aust. Poult. Sci. Symp. 2013.....24
- Page 182 and 183: Aust. Poult. Sci. Symp. 2013.....24
- Page 184 and 185: Aust. Poult. Sci. Symp. 2013.....24
- Page 186 and 187: Aust. Poult. Sci. Symp. 2013.....24
- Page 188 and 189: Aust. Poult. Sci. Symp. 2013.....24
- Page 190 and 191: Aust. Poult. Sci. Symp. 2013.....24
- Page 192 and 193: Aust. Poult. Sci. Symp. 2013.....24
- Page 194 and 195: Aust. Poult. Sci. Symp. 2013.....24
- Page 196 and 197: Aust. Poult. Sci. Symp. 2013.....24
- Page 198 and 199: Aust. Poult. Sci. Symp. 2013.....24
- Page 200 and 201: Aust. Poult. Sci. Symp. 2013.....24
- Page 202 and 203:
Aust. Poult. Sci. Symp. 2013.....24
- Page 204 and 205:
Aust. Poult. Sci. Symp. 2013.....24
- Page 206 and 207:
Aust. Poult. Sci. Symp. 2013.....24
- Page 208 and 209:
Aust. Poult. Sci. Symp. 2013.....24
- Page 210 and 211:
Aust. Poult. Sci. Symp. 2013.....24
- Page 212 and 213:
Aust. Poult. Sci. Symp. 2013.....24
- Page 214 and 215:
Aust. Poult. Sci. Symp. 2013.....24
- Page 216 and 217:
Aust. Poult. Sci. Symp. 2013.....24
- Page 218 and 219:
Aust. Poult. Sci. Symp. 2013.....24
- Page 220 and 221:
Aust. Poult. Sci. Symp. 2013.....24
- Page 222 and 223:
Aust. Poult. Sci. Symp. 2013.....24
- Page 224 and 225:
Aust. Poult. Sci. Symp. 2013.....24
- Page 226 and 227:
Aust. Poult. Sci. Symp. 2013.....24
- Page 228 and 229:
Aust. Poult. Sci. Symp. 2013.....24
- Page 230 and 231:
Aust. Poult. Sci. Symp. 2013.....24
- Page 232 and 233:
Aust. Poult. Sci. Symp. 2013.....24
- Page 234 and 235:
Aust. Poult. Sci. Symp. 2013.....24
- Page 236 and 237:
Aust. Poult. Sci. Symp. 2013.....24
- Page 238 and 239:
Aust. Poult. Sci. Symp. 2013.....24
- Page 240 and 241:
Aust. Poult. Sci. Symp. 2013.....24
- Page 242 and 243:
Aust. Poult. Sci. Symp. 2013.....24
- Page 244 and 245:
Aust. Poult. Sci. Symp. 2013.....24
- Page 246 and 247:
Aust. Poult. Sci. Symp. 2013.....24
- Page 248 and 249:
Aust. Poult. Sci. Symp. 2013.....24
- Page 250 and 251:
Aust. Poult. Sci. Symp. 2013.....24
- Page 252 and 253:
Aust. Poult. Sci. Symp. 2013.....24
- Page 254 and 255:
Aust. Poult. Sci. Symp. 2013.....24
- Page 256 and 257:
Aust. Poult. Sci. Symp. 2013.....24
- Page 258 and 259:
Aust. Poult. Sci. Symp. 2013.....24
- Page 260 and 261:
Aust. Poult. Sci. Symp. 2013.....24
- Page 262 and 263:
Aust. Poult. Sci. Symp. 2013.....24
- Page 264 and 265:
Aust. Poult. Sci. Symp. 2013.....24
- Page 266 and 267:
Aust. Poult. Sci. Symp. 2013.....24
- Page 268 and 269:
Aust. Poult. Sci. Symp. 2013.....24
- Page 270 and 271:
Aust. Poult. Sci. Symp. 2013.....24
- Page 272 and 273:
Aust. Poult. Sci. Symp. 2013.....24
- Page 274 and 275:
Aust. Poult. Sci. Symp. 2013.....24
- Page 276 and 277:
Aust. Poult. Sci. Symp. 2013.....24
- Page 278 and 279:
Aust. Poult. Sci. Symp. 2013.....24
- Page 280 and 281:
Aust. Poult. Sci. Symp. 2013.....24
- Page 282 and 283:
Aust. Poult. Sci. Symp. 2013.....24
- Page 284 and 285:
Aust. Poult. Sci. Symp. 2013.....24
- Page 286 and 287:
Aust. Poult. Sci. Symp. 2013.....24
- Page 289 and 290:
AUTHOR INDEX Name Page(s) Email Add
- Page 291 and 292:
Klein-Hessling, H 207 hkleinhesslin
- Page 293:
Van de Wouw, A 247 nnet.vandewouw@w


