Extension 17.7: Planting Trees
Extension 17.7: Planting Trees
Extension 17.7: Planting Trees

You also want an ePaper? Increase the reach of your titles
YUMPU automatically turns print PDFs into web optimized ePapers that Google loves.
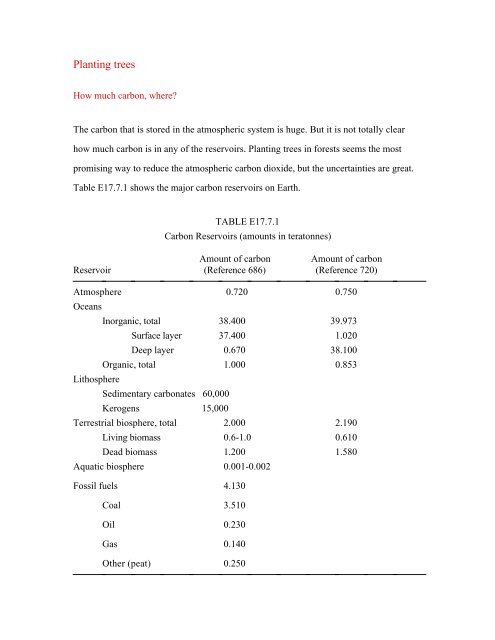
<strong>Planting</strong> trees<br />
How much carbon, where?<br />
The carbon that is stored in the atmospheric system is huge. But it is not totally clear<br />
how much carbon is in any of the reservoirs. <strong>Planting</strong> trees in forests seems the most<br />
promising way to reduce the atmospheric carbon dioxide, but the uncertainties are great.<br />
Table E<strong>17.7</strong>.1 shows the major carbon reservoirs on Earth.<br />
TABLE E<strong>17.7</strong>.1<br />
Carbon Reservoirs (amounts in teratonnes)<br />
Amount of carbon Amount of carbon<br />
Reservoir (Reference 686) (Reference 720)<br />
Atmosphere 0.720 0.750<br />
Oceans<br />
Lithosphere<br />
Inorganic, total 38.400 39.973<br />
Surface layer 37.400 1.020<br />
Deep layer 0.670 38.100<br />
Organic, total 1.000 0.853<br />
Sedimentary carbonates 60,000<br />
Kerogens 15,000<br />
Terrestrial biosphere, total 2.000 2.190<br />
Living biomass 0.6-1.0 0.610<br />
Dead biomass 1.200 1.580<br />
Aquatic biosphere 0.001-0.002<br />
Fossil fuels 4.130<br />
Coal 3.510<br />
Oil 0.230<br />
Gas 0.140<br />
Other (peat) 0.250
Energy, Ch. 17, extension 7 <strong>Planting</strong> trees 2<br />
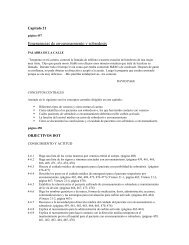
Fig. E<strong>17.7</strong>.1 The carbon cycle.<br />
(Adapted from Department of Energy data and Refs. 202, 203)<br />
Another, pictorial, view of the carbon cycle is shown in Fig. E<strong>17.7</strong>.1. (202,203) The net<br />
exchange with the oceans is 2.2 Gt and with plants on land is 1.7 Gt. While gross<br />
exchanges are much larger than human emissions, human emissions are greater than net<br />
exchanges.<br />
It is estimated by some that forests contain 1 teratonne of carbon (a bit higher than the<br />
estimates above). (41) The yearly fluxes are large, too. Carbon exchange between land and<br />
atmosphere is 120 Pg (120 billion tonnes, or 120 Gt), going both directions; exchanges<br />
between ocean and atmosphere total 90 Pg (90 Gt). (721) Only about half the CO 2 from
Energy, Ch. 17, extension 7 <strong>Planting</strong> trees 3<br />
burning of fossil fuels, about 6.3 Pg (6.3 Gt), appears in the atmosphere, which means<br />
that the other half is going somewhere else. As the amount of carbon in the atmosphere<br />
increases, though, the amount that is exchanged will have to increase in step. By 2100, the<br />
exchanges are expected to be larger, and the ocean sink is expected to increase from 1.7 ±<br />
0.5 Gt/yr (Reference 721) or 2.0 ± 0.6 Gt/yr (Reference 722) to 5 Gt/yr. Land, which is<br />
thought to have been a net carbon source at mid-twentieth century, is now estimated to be<br />
a sink (including a source term from deforestation of about 1.6 Gt/yr) of 1.4 ± 0.7 Gt/yr<br />
(Reference 721) or 1.4 ± 0.8 Gt/yr (Reference 722), and this total is expected to increase<br />
as well to around 5 Gt/yr. (721,722) The carbon will be there permanently, at least as<br />
measured in terms of human lifetimes. (85)<br />
How much carbon is stored or emitted by forests?<br />
There are several reasons for disagreements and uncertainties (such as indicated above and<br />
in the next section). However, in the context of the Kyoto Protocol, with possible offsets<br />
for carbon storage in forests, the situation requires clarification. (723) An experiment that<br />
combined satellite monitoring with a sophisticated ecosystem model (NASA-CASA)<br />
suggested that forests lose 1.2 to 1.3 Gt of carbon every year. (724) The highest losses are<br />
sustained by countries close to the Equator that are losing tropical forest such as Brazil,<br />
the Congo, and Indonesia. (26-29,31,42) The greatest gains in carbon storage are in the<br />
Northern Hemisphere, especially in the Unites States and Canada. (724) According to this<br />
report “the potential for ... carbon gains from forest area regrowth or expansion are<br />
dwarfed by the continuing losses from deforestation and fires.” (724)<br />
Work on Pacific Northwest forests that similarly combines satellite mapping and<br />
modeling showed that the forests used in the pilot study were a source of 1.13 tonnes of<br />
carbon per hectare per year, rather than acting as a sink. (725) A study at the Harvard
Energy, Ch. 17, extension 7 <strong>Planting</strong> trees 4<br />
Forest showed, on the other hand, that the forest there was a net sink of 2.0 ± 0.4 tonnes<br />
of carbon per hectare per year. (726) This study over nine years used eddy covariance to<br />
measure the rate of uptake. (726) So from this conflicting evidence, it is inconclusive<br />
whether forests will be a source or a sink of carbon in the north temperate zone. China’s<br />
forests are apparently storing carbon at present. (727)<br />
Tropical forests are seen as a net source of carbon (from deforestation), (724) but<br />
measurements in mature tropical forests in South America show that tree growth exceeded<br />
loss in 38 out of 50 sites monitored. (728) Another study in Brazil showed that even with<br />
deforestation, land use change and deforestation together nearly balance the carbon (the<br />
Amazon was a source of 200 Mt/yr of carbon over the years of the study). (729) And a<br />
computer simulation shows that even if carbon dioxide stopped growing, the momentum<br />
of increased growth in topical forests could continue for a century more. (730)<br />
There are indications that the warming occurring in the Arctic regions is already leading to<br />
ecosystem changes there. Permafrost is melting at a rapid rate (in the region of tundra<br />
studied, 18% had melted in 1959 and only 13% remained unmelted in 2003). (731) By<br />
2100, central Canada is predicted to have no regions of permafrost left. (a)<br />
The number of shrubs is growing. (732) In the high north, the boreal forest is expected to be<br />
a large sink of carbon under warming, but evidence shows that for Alaskan boreal forests,<br />
droughts coming from changing weather stresses the trees and has not lead to enhanced<br />
sequestration. (733) A study of many European forests at all latitudes showed that uptake<br />
increased as latitude decreased, not as latitude increased. (734) Further, it may be that<br />
afforestation in boreal regions will backfire. The surface albedo changes when the tundra is<br />
replaced by trees, and this could more than compensate for the carbon sequestration,<br />
according to Reference 413 and Reference 735. Experimental evidence is mixed; a 1993
Energy, Ch. 17, extension 7 <strong>Planting</strong> trees 5<br />
study showed that Arctic soils had become drier and become sources of carbon<br />
dioxide, (736) while a more recent study by the same group found that even though the<br />
warming has increased, some regions are sinks for carbon part of the time. (737)<br />
Many people had expected a “carbon dioxide fertilization” effect, in that plants are<br />
limited in the amount of carbon they can fix by the low concentration of atmospheric<br />
carbon dioxide in the atmosphere. Experiments are under way to learn about this as well<br />
as about how plants adapt to a future world with doubled CO 2 concentration, known as<br />
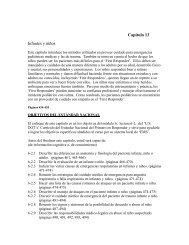
FACE experiments (FACE stands for Free Air CO 2 Enrichment). In these experiments,<br />
pipes arranged in a circle (Fig. E<strong>17.7</strong>.2) emit carbon dioxide at some height above the<br />
surface (CO 2 is heavier than air and so tends to sink) in a locale and the effects are<br />
compared with a comparable nearby plot not enriched in CO 2 . FACE studies, which<br />
originated at Brookhaven National Laboratory, are taking place in seven locations in the<br />
United States, in Switzerland, and in Panama. (738)<br />
Fig. E<strong>17.7</strong>.2 Views of several FACE experimental sites. FACE plots are up to 30 m in diameter and 20 m<br />
high.<br />
(Brookhaven National Laboratory)<br />
A group led by Peter Reich at the University of Minnesota studied how elevated CO 2<br />
affected grassland in one FACE experiment, 6 native grasses and herbaceous plants in<br />
various combinations on six plots in Cedar Creek Natural History Area and found that
Energy, Ch. 17, extension 7 <strong>Planting</strong> trees 6<br />
“enhanced biomass accumulation in response to elevated levels of CO 2 or nitrogen, or<br />
their combination, is less in species-poor than in species-rich assemblages.” (739) The<br />
implication of this experiment is that a less diverse biome will be less efficient at carbon<br />
dioxide absorption than a more diverse biome.<br />
Another FACE experiment showed that estimates of forest productivity in a CO 2 -<br />
enhanced world might be too optimistic. Two sites were compared, one moderately<br />
nutrient rich, the other nutrient poor. Some biomass was added at the nutrient-rich site,<br />
but none on the nutrient-poor site. The added biomass disappeared after three years. (411)<br />
This suggests that fertility affects the response to added carbon dioxide, and that it is not<br />
clear that there will be added carbon sequestration in forests. Two different experiments<br />
shed some light on this question as well. In one, a group tried and failed to find indications<br />
of the “carbon dioxide fertilization” effect using inventory data from over 20,000 forest<br />
plots in five eastern states. (740) So, in this case, we would expect the forest sink<br />
eventually to disappear. Additionally, Cox et al. used a three-dimensional carbon-cycle<br />
model to find that “carbon-cycle feedbacks could significantly accelerate climate change.”<br />
They mean by this that in their model land became a source of carbon dioxide around<br />
2050. (741)<br />
Adding carbon dioxide caused massive (threefold) gains in set seeds in one<br />
experiment. (742) This occurred in a stand of 19-year-old loblolly pines (Pinus taeda) after<br />
four years of enriched carbon dioxide. Since most loblolly pine stands are regenerated<br />
naturally, the spread may become faster than at present. They could take over from other<br />
species at elevated CO 2 levels.<br />
At a different site, increased CO 2 levels led to total net primary production gain of 25%<br />
for pine trees, implying that a lot of carbon could be sequestered. (743) In a study involving
Energy, Ch. 17, extension 7 <strong>Planting</strong> trees 7<br />
a variety of forest types in Costa Rica, the upper and lower bounds on net primary<br />
productivity (NPP) varied greatly from site to site. (744) A study over 18 years of records<br />
from satellites and climate data indicates an increase in NPP. (745) However, additional<br />
research shows that this is limited to an approximately three-year timespan, after which<br />
storage decreases significantly. (746) Schlesinger and Lichter find that nearly half of the<br />
carbon uptake is allocated to short-lived tissues, for example, leaves or needles. When the<br />
leaves fall to the ground, they do not contribute much carbon to the underlying soil. (746)<br />
The authors say “Such findings call into question the role of soils as long-term carbon<br />
sinks, and show the need for a better understanding of carbon cycling in forest soils.” (746)<br />
Additionally, experiments in fungi indicate that the FACE approach—abrupt alteration in<br />
the concentration of carbon dioxide, which cannot occur in the “real world”—may not tell<br />
an accurate story. Fungi living under the condition of gradual increase of CO 2 showed<br />
little difference from control groups. Fungi exposed to abrupt shifts in concentration<br />
showed great differences. (b) This may mean that the FACE approach overstates the<br />
carbon dioxide fertilization effect.<br />
Lal has emphasized the role of soil carbon storage in agricultural soils. (747) In many<br />
regions of the world, agricultural soils have been degraded in carbon. Lal estimates the<br />
total soil carbon loss at 42 to 78 Gt of carbon. Restoring carbon to such degraded soils can<br />
enhance future crop production: “An increase of 1 ton of soil carbon pool of degraded<br />
cropland soils may increase crop yield by 20 to 40 kilograms per hectare (kg/ha) for<br />
wheat, 10 to 20 kg/ha for maize, and 0. 5 to 1 kg/ha for cowpeas.” Lal believes that this<br />
soil rehabilitation could take place over as little as two decades. (747)<br />
For carbon storage to take place, soil nitrogen must also be available. Hungate et al. have<br />
examined the possibilities using GCMs, and conclude that in scenarios with high nitrogen
Energy, Ch. 17, extension 7 <strong>Planting</strong> trees 8<br />
accumulation, the amount reaching the soils “is less than is required by all CO 2 -only<br />
simulations and by four of the six CO 2 -climate simulations. Our low estimates of nitrogen<br />
accumulation yield only 1.2 Pg of nitrogen, insufficient for all simulations.” (748)<br />
In opposition to intuition, carbon is lost when woody plants invade grassland, not stored.<br />
Drier sites did gain soil carbon, but wetter sites lost soil carbon. (749) Another study of<br />
soil carbon found that carbon lost to the soils may have been stored in woody tissue,<br />
suggesting that there is no long-term carbon storage loss; it would simply be<br />
transferred. (750) A study of Chinese forests between 1949 and 1998 found that the<br />
forests had lost on average 22 Gt/yr of carbon between 1949 and 1980, and gained on<br />
average 21 Gt/yr between 1980 and 1998. (727) A long-term study in the Amazon found<br />
that the warmer forest ecosystem is changed substantially from the earlier ecosystem. (541)<br />
Transpiration can increase in a warmer world, and this may dissicate forests in dry<br />
regions that already struggle to exist. (751) Studies such as these raise the question of<br />
whether forests have any long-term capacity to store carbon or not. This appears still to<br />
be an open question. This question is discussed at length in Reference 319 with special<br />
attention to forests in the context of the situation to come during the twenty-first<br />
century.<br />
In terms of need, the fuelwood crisis in developing countries is leading to deforestation, so<br />
afforestation projects are an important counter to these losses. However, most near-term<br />
forest carbon storage projects will take place in the developed world. (752)<br />
The U.S. land carbon “sink” has been growing for reasons that had eluded scientists, but a<br />
suggestion that might work is that it is due to the increased rain falling on the continental<br />
United States. (753,754) Nemani et al. found that increases in humidity and precipitation<br />
were correlated with increased growth and accounted for two-thirds of it. A mechanism
Energy, Ch. 17, extension 7 <strong>Planting</strong> trees 9<br />
exists that can explain this correlation. In wetter times, the stomata (pores) in the leaves<br />
open more, taking in more CO 2 . More water reaches the roots, too, helping stimulate<br />
growth. The possible problem with this explanation is the uncertainty over what led to<br />
the increased rainfall in the first place. This study suggests that if that pattern of<br />
increasing humidity and rainfall changes, the increased growth of the “sink” for carbon in<br />
the plants will, too. (754)<br />
It may now appear questionable whether we know anything at all. We are very lucky to<br />
have learned a substantial amount in recent years about the carbon cycle. Details of the<br />
effect of CO 2 on forests remains somewhat cloudy, but we now have a better set of<br />
questions to ask about how forests store carbon (and how the terrestrial biosphere as a<br />
whole stores carbon). (755) Most investigators are still convinced that forests can absorb<br />
significant amounts of carbon. In fact, there is mounting evidence that forests can act as<br />
sinks of carbon until advanced tree ages. (756) The carbon in an old forest is found in tree<br />
trunks and limbs, but it is also found deep in the soil in roots and carbon-rich zones<br />
surrounding the roots, where it can remain for centuries. (757) Additionally, as Marland has<br />
pointed out, use of trees for fuel would seem to indicate a smaller storage capacity, while<br />
it replaced a much larger source of CO 2 , so that a proper accounting should include these<br />
beneficial alternative uses. (758)<br />
Several estimates have been made of the actual area needed to absorb all the carbon<br />
currently being produced.(Reforestation will only delay the effects of the greenhouse<br />
warming that occurs as long as fossil fuels continue to be used.) Marland (759) estimates,<br />
on the basis of measurements of carbon fixation by American sycamore trees on a<br />
plantation in Georgia, that one hectare absorbs 7.5 t/yr, so an area of some 7 million km 2<br />
would be needed to fix all CO 2<br />
being released. For comparison’s sake, 7 million km 2 is<br />
about the area of Australia, one-third the area of North America, or one-fourth the area of
Energy, Ch. 17, extension 7 <strong>Planting</strong> trees 10<br />
Africa. F. Myers (760) of the World Wildlife Fund instead used tropical pines and<br />
eucalyptus to estimate a net fixation of 10 tonnes of carbon per hectare per year. Thus,<br />
foresting of 465 to 670 Mha, compared to a current forest area of 3.4 Gha, would be<br />
required to sequester the 5 Gt/yr released by fossil fuel burning. (40) Marland and<br />
coworkers at the New Zealand Forest Research Institute found that Pinus radiata that is<br />
harvested and replanted socked away 112 tonnes of carbon per hectare over the course of<br />
the lifetime of the trees. (761)<br />
A recent estimate of the one-time cost of planting enough trees to absorb 2 to 3 Gt of<br />
carbon per year is $186 to $372 billion. (762) It would cost $230 to $1,000 per hectare for<br />
planting plus land cost of $400-$1,000 per hectare. (762) The estimated cost is $2.2/t of<br />
carbon removed. (40) This cost should be compared to the cost of doing nothing. A sea<br />
level rise could cause $300 million in land loss alone. A recent estimate by the EPA of the<br />
total cost of protecting against a 1 m rise in sea level would be $73 to $110 billion. (496) Of<br />
course, not all the CO 2<br />
would have to be compensated. It would be possible, for example,<br />
to forest 300 Mha for $120 billion and achieve a 26% CO 2<br />
reduction. (763)<br />
One study of vegetative storage asserts that “[t]emporary carbon stores would only be<br />
beneficial for climate change impacts related to the cumulative impact of CO 2<br />
, but it could<br />
even worsen impacts mediated via the instantaneous effect of temperature or those related<br />
to the rate of change. Hence, the planting of trees is only beneficial in reducing climatechange<br />
impacts if the most serious impacts are those related to the cumulative effect of<br />
increased temperature.” (764)<br />
Costs are expected to range between $10 and $150 per tonne and worldwide up to 2<br />
Gt/yr could be stored at this price, but secondary benefits occur as well that can reduce<br />
the final cost—if these are high enough, forest storage of CO 2<br />
may be a “no regrets”
Energy, Ch. 17, extension 7 <strong>Planting</strong> trees 11<br />
storage option. (765) One problem in making comparisons among projects is that the<br />
phrase “dollar per tonne” may mean different things, depending on the author. In the<br />
review article (Reference 784), it was found that after correcting for this disparity, many<br />
projects were feasible at estimated costs of under $50/t. The authors write “when<br />
compared to source control of fossil fuel emissions ... [various estimates] ... for the world<br />
suggest that one-third to one-half of a sizable carbon reduction program could be cost<br />
effectively accomplished through carbon sequestration.”<br />
Vegetative growth over North America has increased over the last several decades. The<br />
About half the tree cover originally on Earth before the beginnings of agriculture has been<br />
cut. (719) <strong>Planting</strong> some five to six times the number of trees currently being cut should<br />
lead to absorption of the 5 Gt of carbon per year needed to absorb the human-generated<br />
carbon. The timescale is several decades before large plantations in the tropics would<br />
seriously affect the CO 2<br />
level in the atmosphere. (766) We already know that deforestation<br />
of some 7 to 20 million hectares per year (mainly in the tropics) is pumping about 1 Gt of<br />
carbon per year into the atmosphere. Conversion of old-growth forests to young forests<br />
will not decrease CO 2<br />
. It is better to leave old-growth trees standing. On-site carbon<br />
storage does not approach old-growth storage for 200 years. (767)<br />
An additional question is whether, as most models (including the IPCC models) assert,<br />
that increased temperatures lead to increased respiration, which leads to a situation in<br />
which the forests’ decaying organic matter becomes a source of carbon dioxide. However,<br />
some experiments have found that the decomposition rates in soils do not vary with<br />
temperature. (768) A study of plots in grassland showed that soil respiration acclimatized<br />
to warming, in basic agreement with Reference 768. (769) An additional piece of evidence is<br />
that a study of artificially warmed tundra showed almost no difference in carbon emission
Energy, Ch. 17, extension 7 <strong>Planting</strong> trees 12<br />
from the control plot. (770) So perhaps the forests will continue to be able to store carbon,<br />
even at heightened temperatures.<br />
Controversy over the size of the United States sink<br />
As there are no carbon meters available directly, the transfers of carbon must be found in<br />
indirect ways. Several lines of reasoning indicate that the Northern Hemisphere acts as a<br />
carbon sink. The gradient of CO 2 north-south is smaller than expected, and the oceanic<br />
partial pressure of CO 2 also indicates carbon uptake in the north. (85) One method, known<br />
as “inversion modeling” uses the available data and partitions it using models of oceanic<br />
uptake and release, and models for the global distribution of the released CO 2 through the<br />
action of the winds. With this method, Fan and coworkers found that most landmasses<br />
were poorly constrained in terms of their ability to store of produce carbon, but that<br />
North America was well-constrained. (771) Reference 771 claims a storage for North<br />
America of 1.7 ± 0.5 Gt/yr, most south of 51° N (that is, the United States). Believing<br />
this is fraught with difficulty, because this is about the amount of carbon emitted by<br />
North America through burning fossil fuels!<br />
A different method was used by Houghton, Hackler, and Lawrence, who adopted a model<br />
such as the Harvey model to look from the bottom up at carbon uptake and emission. (772)<br />
Their analysis was carried out for the period from 1700 to the present. They found that<br />
about one-quarter of carbon flux is attributable to land-use changes. They also found that<br />
the United States was a sink for carbon, with the greatest storage occurring in the 1950s<br />
and 1960s. In the 1980s, carbon accumulated at 0.15 to 0.35 Gt/yr. (772) They interpret<br />
the storage as being a result of land management practices in recent times (about half the<br />
total storage). (674,718,772) This is both good news and bad. Carbon is accumulating in<br />
North America. But, since the changes have been made some time ago, they are soon due
Energy, Ch. 17, extension 7 <strong>Planting</strong> trees 13<br />
to saturate (that is, the storage will go away as the ecosystems reach equilibrium), and<br />
this is not admissible under the Kyoto Treaty as a credit. (772) Other investigators also<br />
found that changes in land use have large effects, using a computer model of vegetative<br />
ecosystems. (674,718,773) It is well-known that a lot of U.S. farmland has returned to forest<br />
over the last century (it is estimated that 9 to 11 Mha of former agricultural land is now<br />
forested).<br />
You may recall that aerosol pollution affects climate as well as people’s health. Wetlands<br />
emit 115 to 237 Mt/yr. (774) In a similar way, sulfur pollution appears to affect the health<br />
of bogs (in a favorable way) as well as the health of people. Wetlands emit methane, and<br />
warmer wetlands emit greater amounts of methane (a global warming feedback), but<br />
apparently increasing sulfuric acid deposition reduces emissions of methane from<br />
peatlands, and Gauci et al. apply this knowledge to wetlands in general. (775) The<br />
researchers estimate that current levels of sulfur deposition on wetlands reduce the<br />
amount of methane emitted by 15 Mt/yr, decreasing emissions by 8%. If current trends<br />
continue, by 2030 the resuction will be 26 MT/yr, or 15% of total wetland<br />
emissions. (775) From this research, it is possible to infer “that the observed increase in<br />
atmospheric CH 4 concentration throughout the 20th century is the result of factors other<br />
than growth in the contribution from wetlands.” (775)<br />
Bonan found that changing forest to cropland caused cooling to occur, rather than the<br />
reverse. (776) The computer study showed a correlation between land use and cooling over<br />
the course of the twentieth century. (776) Rice is an important crop for billions of people<br />
worldwide, and methane emissions from rice cultivation are an important source of<br />
greenhouse gases. (153) The emissions from rice cultivation can be greatly reduced. (777)<br />
Urban land also behaves differently from forest or grassland, storing less carbon and
Energy, Ch. 17, extension 7 <strong>Planting</strong> trees 14<br />
emitting more nitrous oxide. (778) Aye et al. consider these effects to be arising at different<br />
urban scales, (778)<br />
[O]ur results support three hypothetical links between human decisions and<br />
biogeochemistry at multiple scales. At the regional scale, our data suggest that<br />
bio-geochemical fluxes depend on which land-cover types are converted to<br />
urban use. The conversion of grasslands to urban use (increasing N 2 O,<br />
decreasing CH 4 ) will have a much different effect than conversion of corn to<br />
urban use (moderate decrease in N 2 O, no change in CH 4 ). At the landscape or<br />
neighborhood scale, we hypothesize that effects of urbanization depend on<br />
landscape architecture, especially the proportion of the landscape that is<br />
lawns vs. impervious surfaces. At the household scale, we hypothesize that<br />
individual management decisions (irrigation and fertilization levels) are<br />
important determinants of biogeochemical fluxes.<br />
Additionally, Nemitz et al. find that urban traffic, particularly at rush hour, releases CO 2<br />
and heat directly into the city and affects local climate. (779) Similarly, Grimmond et al.<br />
find their “observations at a single suburban site in Chicago show significant diurnal<br />
variations in CO 2 concentrations. The CO 2 concentrations are elevated relative to global<br />
background values” at ground level, but not as much at higher elevations. (780) Grimmond<br />
et al. also find that carbon dioxide is being removed from the air in leafy neighborhoods.<br />
As a result of all this research, it is clear that land-use change is an important cause of<br />
regional—and global—climate change.<br />
This agrees with the IPCC and other studies. However, it seems to be the direct opposite<br />
of what has been found by others. Computer models of forest growth on the Great<br />
Planins shows that the opposite occurs. (781) Climate change with increased temperatures<br />
leads to changes in composition, but little change in diversity. As research has shown the<br />
effect of warming is not in increased daytime temperatures, but in increases in the<br />
nighttime temperatures. (322) The so-called diurnal temperature range has gotten smaller.
Energy, Ch. 17, extension 7 <strong>Planting</strong> trees 15<br />
Interestingly, the decrease in the range in the last few decades may have set into motion a<br />
process that makes the range even smaller. The range decreased 3° to 5° C between 1950<br />
and 1993. (412,782) The study found that satellite observations over Canada could not be<br />
explained by the totality of non-biospheric parameters. Only if the effects of vegetation<br />
are included could the observations be explained. The vegetation seem to have caused an<br />
additional warming. (412)<br />
A study by Pacala et al. (783) constituted of an extensive land-based survey of the lower<br />
48 states and correlations with results from 27 different atmospheric studies. They find<br />
that trees and other vegetation took up 0.3 to 0.7 Gt/yr of carbon between 1980 and<br />
1989. (783)<br />
According to a review of the literature, “the terrestrial biosphere was largely neutral with<br />
respect to net carbon exchange during the 1980s, but became a net carbon sink in the<br />
1990s.” They attribute the change to northern temperate regions. They note that tropical<br />
land areas were approximately in balance, (784) as others have found. (728,729) There is<br />
possibly a local carbon sink that offsets the emissions from tropical deforestation. Clark<br />
finds the opposite, however, from her studies in Costa Rica. (785)<br />
TABLE E<strong>17.7</strong>.2<br />
Carbon Stocks in World Biomass and Soils<br />
Area Global Carbon Stocks (Gt C)<br />
Biome (10 9 ha) Vegetation Soil Total<br />
Tropical forests 1.76 212 216 428<br />
Temperate forests 1.04 59 100 159<br />
Boreal forests 1.37 88 471 559<br />
Tropical savannas 2.25 66 264 330<br />
Temperate grasslands 1.25 9 295 304<br />
Deserts and semideserts 4.55 8 191 199
Energy, Ch. 17, extension 7 <strong>Planting</strong> trees 16<br />
Tundra 0.95 6 121 127<br />
Wetlands 0.35 15 225 240<br />
Croplands 1.60 3 128 131<br />
Total 15.12 466 2011 2477<br />
Source: Reference 73, Table 1<br />
The IPCC has certainly a role to play in this question, and they have. (72) Table E<strong>17.7</strong> 2<br />
shows in detail the estimated amounts of carbon in the near-surface and above-surface<br />
biomass. According to the IPCC, about 270 Gt of carbon has been emitted between 1850<br />
and 2000 due to burning of fossil fuels and 136 Gt from land-use change. (73) After<br />
accounting for the amount in the atmosphere, which changed by about 176 Gt in that<br />
time, they find that about 230 Gt must have been taken up by the planet by some<br />
mechanism (they assume the carbon was divided roughly equally between oceanic and<br />
terrestrial uptake). (73)<br />
The net planetary uptake was about 0.2 ± 1.0 Gt/yr in the 1980s and 0.7 ± 1.0 Gt/yr in<br />
the 1990s. (73,784) As is usual with IPCC, there are several different scenarios used, which<br />
give slight differences among the apportionment of carbon storage. An IPCC Definitional<br />
Scenario was chosen in order to report everything equally clearly. In this scenario, several<br />
estimates of the effects of deforestation and afforestation were given. Between 2008 and<br />
2012, the report expects a carbon sequestration of 197 to 584 Mt/yr of carbon from<br />
afforestation and reforestation. The expected deforestation is estimated to be about 1.8<br />
Gt/yr. This means a release of between 1.2 and 1.6 Gt/yr of carbon. The bright side, as<br />
the study points out, is that it is feasible to expect a 20% increase in reforestation and<br />
afforestation, which would remove a further 11 to 45 Mt/yr of carbon (but unfortunately,<br />
this is still small in comparison to the emissions).
Energy, Ch. 17, extension 7 <strong>Planting</strong> trees 17<br />
Some critics doubt that trees can do the job. The Royal Society says that such measures<br />
can take care of just one-quarter of the sequestration needed by 2050. (786)<br />
The IPCC report finds that improved forest management, improved cropland<br />
management, improved grazing land management, conversion of cropland to grassland, and<br />
improved agroforestry could provide about 270 Mt/yr of carbon storage for the Annex I<br />
countries (about 260 Mt/yr from better management and 30 Mt/yr from land-use<br />
change). (73) This implies that the Annex I countries could virtually wipe out the effects of<br />
their carbon emissions by adopting improved management practices and converting some<br />
cropland to grass. This, in turn, means that achieving the Kyoto emissions goals will be<br />
less costly than had been thought, especially by U.S. politicians who have argued against<br />
the adoption of the Kyoto treaty because of its projected huge costs (see the extended<br />
discussion of costs and responsibilities of carbon emission in <strong>Extension</strong> 17.8, Why we<br />
should support the Kyoto Protocol).<br />
For the world as a whole, the situation looks different, according to the IPCC, as the landuse<br />
change contribution totals 335 Mt/yr and better land-use management 570 Mt/yr in<br />
carbon storage. (73) This assumes, of course, that land management changes from cropland<br />
to grassland or forest will result in greater carbon storage.<br />
References in addition to those listed for this chapter are shown in red in the text, and<br />
listed below:<br />
a. P. Camill, “Permafrost thaw accelerates in boreal peatlands during late-20th century<br />
climate warming,” Clim. Change 68, 135 (2005).<br />
b. J. N. Klironomos, M. F. Allen, M. C. Rillig, J. Piotrowski, S. Makvandi-Nejad, B. E.<br />
Wolfe, and J. R. Powell, “Abrupt rise in atmospheric CO 2 overestimates community<br />
response in a model plant–soil system,” Nature 433, 621 (2005).