Pacific Islands Environment Outlook - UNEP
Pacific Islands Environment Outlook - UNEP
Pacific Islands Environment Outlook - UNEP

You also want an ePaper? Increase the reach of your titles
YUMPU automatically turns print PDFs into web optimized ePapers that Google loves.
24<br />
STATE OF THE ENVIRONMENT<br />
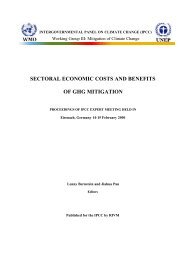
range of average daily waste generated in the domestic<br />
sector: from 0.2 kg/person/day in Rarotonga, Cook<br />
<strong>Islands</strong>, to 0.7 kg/person/day in Tongatapu, Tonga<br />
(Government of Kingdom of Tonga 1994). The same<br />
studies further highlighted that the household waste<br />
stream in most <strong>Pacific</strong> island states is dominated by<br />
biodegradable material (vegetable and putrescible<br />
materials and garden wastes). However, there is also a<br />
relatively high proportion of paper and plastics<br />
(average 22.5 per cent of total waste generation),<br />
metals (average 11 per cent of total waste generation)<br />
and glass bottles in the waste stream. Few data are<br />
available for commercial or industrial wastes as in most<br />
PICs most (recorded) waste is currently generated by<br />
the domestic sector (WHO 1996).<br />
In the larger towns, the search for environmentally<br />
safe and socially acceptable sites for solid waste disposal<br />
has become a perennial concern, which is, for several<br />
towns at least, seemingly insoluble. In smaller<br />
settlements and coastal peri-urban situations, mangrove<br />
areas or beaches have become the casual dumping<br />
grounds for much of the waste, ranging from derelict cars<br />
to household refuse. Expected further urbanization and<br />
industrialization will make these problems even worse.<br />
Inadequate sanitation systems for the disposal or<br />
treatment of liquid wastes have resulted in high<br />
coliform contamination in surface waters and in<br />
groundwater near urban areas. Various incidents have<br />
also been reported of pollution by toxins from industrial<br />
waste, effluent from abattoirs or food-processing plants,<br />
by biocides and by polluted effluent from sawmills and<br />
timber processing areas.<br />
Figure 1.9 and Tables 1.5 and 1.6 provide an<br />
insight into solid waste generation and the<br />
contributions of wastewater to pollutant loads in urban<br />
centres in the region.<br />
The last ten years have seen the continued use of a<br />
range of chemicals for agriculture and manufacturing.<br />
The region in general has little capacity for monitoring<br />
the pollution from toxic and hazardous substances but<br />
Figure 1.9: Characteristics of municipal solid waste in PICs<br />
Honiara,<br />
Solomon <strong>Islands</strong><br />
1990<br />
Pohnpei,<br />
FSM<br />
1991<br />
Apia,<br />
Samoa<br />
1993<br />
Rarotonga,<br />
Cook <strong>Islands</strong><br />
1994<br />
Nuku’alofa,<br />
Tonga<br />
1994<br />
Majuro,<br />
Marshall <strong>Islands</strong><br />
1991<br />
Composition<br />
(% by wet weight)<br />
18<br />
2<br />
4<br />
8<br />
2<br />
11<br />
13<br />
1<br />
1<br />
17<br />
45<br />
7<br />
11<br />
1<br />
1<br />
13<br />
12<br />
60<br />
2<br />
13<br />
3<br />
2<br />
16<br />
10<br />
Vegetable/Putrescible<br />
Paper<br />
Textile<br />
Leather / Rubber<br />
Plastic<br />
Metal<br />
66<br />
17<br />
8<br />
13<br />
3<br />
8<br />
14<br />
17<br />
28<br />
16<br />
2<br />
6<br />
44<br />
Glass / Ceramic<br />
Garden Waste<br />
32<br />
2<br />
14<br />
1<br />
9<br />
7<br />
2<br />
4<br />
6<br />
Miscellaneous<br />
0.38 0.38<br />
0.52<br />
0.19<br />
0.68<br />
0.38<br />
Generation Rate<br />
(kg/capita/day)<br />
270 120<br />
350<br />
100<br />
–<br />
Source: World Health Organization (1996)<br />
110<br />
Bulk Density (kg/m 3 )