Pacific Islands Environment Outlook - UNEP
Pacific Islands Environment Outlook - UNEP
Pacific Islands Environment Outlook - UNEP
Create successful ePaper yourself
Turn your PDF publications into a flip-book with our unique Google optimized e-Paper software.
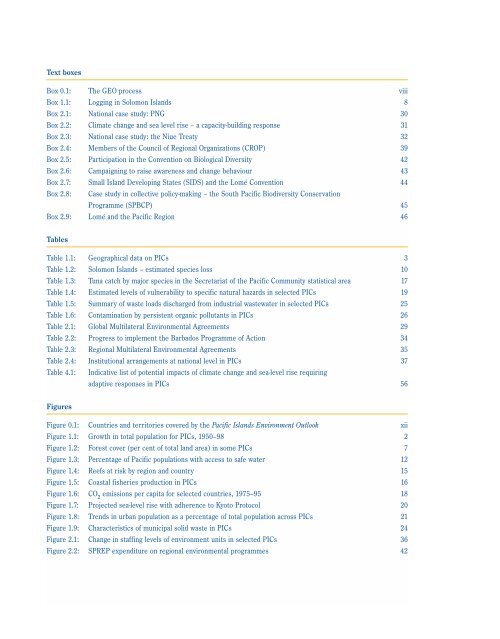
Text boxes<br />
Box 0.1: The GEO process viii<br />
Box 1.1: Logging in Solomon <strong>Islands</strong> 8<br />
Box 2.1: National case study: PNG 30<br />
Box 2.2: Climate change and sea level rise – a capacity-building response 31<br />
Box 2.3: National case study: the Niue Treaty 32<br />
Box 2.4: Members of the Council of Regional Organizations (CROP) 39<br />
Box 2.5: Participation in the Convention on Biological Diversity 42<br />
Box 2.6: Campaigning to raise awareness and change behaviour 43<br />
Box 2.7: Small Island Developing States (SIDS) and the Lomé Convention 44<br />
Box 2.8: Case study in collective policy-making – the South <strong>Pacific</strong> Biodiversity Conservation<br />
Programme (SPBCP) 45<br />
Box 2.9: Lomé and the <strong>Pacific</strong> Region 46<br />
Tables<br />
Table 1.1: Geographical data on PICs 3<br />
Table 1.2: Solomon <strong>Islands</strong> – estimated species loss 10<br />
Table 1.3: Tuna catch by major species in the Secretariat of the <strong>Pacific</strong> Community statistical area 17<br />
Table 1.4: Estimated levels of vulnerability to specific natural hazards in selected PICs 19<br />
Table 1.5: Summary of waste loads discharged from industrial wastewater in selected PICs 25<br />
Table 1.6: Contamination by persistent organic pollutants in PICs 26<br />
Table 2.1: Global Multilateral <strong>Environment</strong>al Agreements 29<br />
Table 2.2: Progress to implement the Barbados Programme of Action 34<br />
Table 2.3: Regional Multilateral <strong>Environment</strong>al Agreements 35<br />
Table 2.4: Institutional arrangements at national level in PICs 37<br />
Table 4.1: Indicative list of potential impacts of climate change and sea-level rise requiring<br />
adaptive responses in PICs 56<br />
Figures<br />
Figure 0.1: Countries and territories covered by the <strong>Pacific</strong> <strong>Islands</strong> <strong>Environment</strong> <strong>Outlook</strong> xii<br />
Figure 1.1: Growth in total population for PICs, 1950–982<br />
Figure 1.2: Forest cover (per cent of total land area) in some PICs 7<br />
Figure 1.3: Percentage of <strong>Pacific</strong> populations with access to safe water 12<br />
Figure 1.4: Reefs at risk by region and country 15<br />
Figure 1.5: Coastal fisheries production in PICs 16<br />
Figure 1.6: CO 2<br />
emissions per capita for selected countries, 1975–95 18<br />
Figure 1.7: Projected sea-level rise with adherence to Kyoto Protocol 20<br />
Figure 1.8: Trends in urban population as a percentage of total population across PICs 21<br />
Figure 1.9: Characteristics of municipal solid waste in PICs 24<br />
Figure 2.1: Change in staffing levels of environment units in selected PICs 36<br />
Figure 2.2: SPREP expenditure on regional environmental programmes 42


