

PHYS08200605006 D.K. Hazra - Homi Bhabha National Institute
PHYS08200605006 D.K. Hazra - Homi Bhabha National Institute
PHYS08200605006 D.K. Hazra - Homi Bhabha National Institute

Create successful ePaper yourself
Turn your PDF publications into a flip-book with our unique Google optimized e-Paper software.
1.2. THE INFLATIONARY PARADIGM<br />
yet to detect any tensor perturbations. The tensor spectral index in the theoretical models<br />
often proves to be small enough that it is usually set to be zero when comparing with<br />
the observations, while the seven-year WMAP data [19] and the ACT data [15] suggest<br />
the upper bound on the tensor-to-scalar ratio r to be 0.24 at 95% Confidence Level (CL).<br />
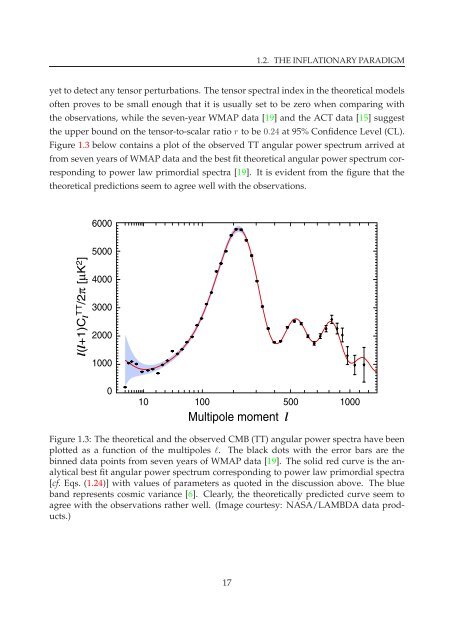
Figure 1.3 below contains a plot of the observed TT angular power spectrum arrived at<br />
from seven years of WMAP data and the best fit theoretical angular power spectrum corresponding<br />
to power law primordial spectra [19]. It is evident from the figure that the<br />
theoretical predictions seem to agree well with the observations.<br />
Figure 1.3: The theoretical and the observed CMB (TT) angular power spectra have been<br />
plotted as a function of the multipoles l. The black dots with the error bars are the<br />
binned data points from seven years of WMAP data [19]. The solid red curve is the analytical<br />
best fit angular power spectrum corresponding to power law primordial spectra<br />
[cf. Eqs. (1.24)] with values of parameters as quoted in the discussion above. The blue<br />
band represents cosmic variance [6]. Clearly, the theoretically predicted curve seem to<br />
agree with the observations rather well. (Image courtesy: NASA/LAMBDA data products.)<br />
17


