- Page 2 and 3:
WORLD HEALTH ORGANIZATION INTERNATI
- Page 4 and 5:
Contents Foreword .................
- Page 6 and 7:
Foreword The maintenance of a regis
- Page 8 and 9:
2 Introduction and an increased exp
- Page 10 and 11:
4 G. Wagner the first time to elimi
- Page 12 and 13:
6 G. Wagner International Symposium
- Page 14 and 15:
8 0. M. Jensen and H.H. Storm made
- Page 16 and 17:
k d Table 2. Worldwide variation in
- Page 18 and 19:
O.M. Jensen and H.H. Storm Hodgkin
- Page 20 and 21:
O.M. Jensen and H.H. Storm ~i~ure 2
- Page 22 and 23:
16 O.M. Jensen and H.H. Storm 1oo.0
- Page 24 and 25:
0. M. Jensen and H. H. Storm Figure
- Page 26 and 27:
O.M. Jensen and H.H. Storm -44 year
- Page 28 and 29:
Chapter 4. Planning a cancer regist
- Page 30 and 31:
24 0. M. Jensen and S. Whelan parti
- Page 32 and 33:
26 0. M. Jensen and S. Whelan Numbe
- Page 34 and 35:
28 0. M. Jensen and S. Whelan Concl
- Page 36 and 37:
30 J. Powell sources, firstly, to p
- Page 38 and 39:
32 J. Powell reports. If a histolog
- Page 40 and 41:
34 J. Powell needs but conserving t
- Page 42 and 43:
36 J. Powell Health insurance (work
- Page 44 and 45:
38 J. Powell episodes-that is, with
- Page 46 and 47:
The disadvantages are : - the quali
- Page 48 and 49:
42 J. Powell (c) medical doctors in
- Page 50 and 51:
44 R. MacLennan Table 1. Basic info
- Page 52 and 53:
codes (population groups, occupatio
- Page 54 and 55:
48 R. MacLennan morphology (item 21
- Page 56 and 57:
50 R. MacLennan or convention to th
- Page 58 and 59:
facilities and to the acceptance of
- Page 60 and 61:
54 R . MacLennan second generation
- Page 62 and 63:
56 R. MacLennan Item 18 : Certainty
- Page 64 and 65:
2. Carcinoma in situ Intraepithelia
- Page 66 and 67:
code allocated as item 20 should re
- Page 68 and 69:
Hospital registries will wish to el
- Page 70 and 71:
Chapter 7. Classification and codin
- Page 72 and 73:
66 C.S. Muir and C. Percy Primarily
- Page 74 and 75:
68 C.S. Muir and C. Percy obtained
- Page 76 and 77:
70 C.S. Muir and C. Percy Topograph
- Page 78: Table 2. Coding of selected cancers
- Page 81 and 82: CIassification and coding of neopla
- Page 83 and 84: CIassiJication and coding of neopla
- Page 85 and 86: ClassiJication and coding of neopla
- Page 87 and 88: Class$cation and coding of neoplasm
- Page 89 and 90: Manual and computerized cancer regi
- Page 91 and 92: New notification I Manual and compu
- Page 93 and 94: Manual and computerized cancer regi
- Page 95 and 96: Manual and computerized cancer regi
- Page 97 and 98: Manual and computerized cancer regi
- Page 99 and 100: Disk storage Manual and computerize
- Page 101 and 102: Manual and computerized cancer regi
- Page 103 and 104: Manual and computerized cancer regi
- Page 105 and 106: Manual and computerized cancer regi
- Page 107 and 108: Chapter 9. Quality and quality cont
- Page 109 and 110: Quality and quality control 103 It
- Page 111 and 112: Consistency checks Quality and qual
- Page 113 and 114: Standards Quality and quality contr
- Page 115 and 116: 0. M. Jensen and H. H. Storm 109 th
- Page 117 and 118: Reporting of results 111 Evaluation
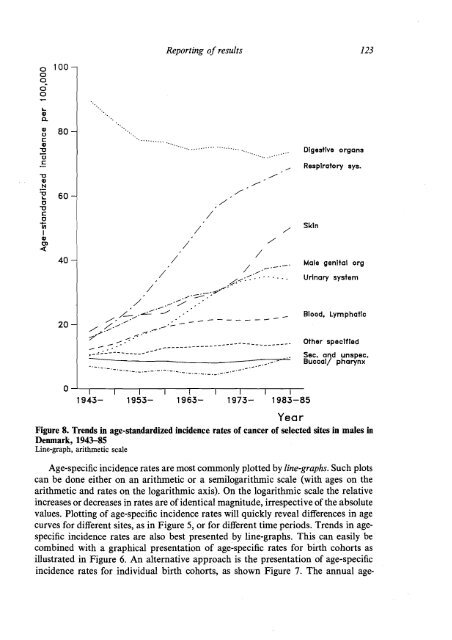
- Page 119 and 120: Reporting of results 113 should giv
- Page 121 and 122: 171 Connective tiaaue 1 3 5 11 10 1
- Page 123 and 124: - 0 - 0 - m o m m L O N I O I O O o
- Page 125 and 126: Reporting of results Number of case
- Page 127: Reporting of results Figure 5. Age-
- Page 131 and 132: Reporting of results Year of diagno
- Page 133 and 134: Statistical methods for registries
- Page 135 and 136: Statistical methods for registries
- Page 137 and 138: Statistical methods for registries
- Page 139 and 140: Statistical methods for registries
- Page 141 and 142: Statistical methods for registries
- Page 143 and 144: Statistical methods for registries
- Page 145 and 146: Statistical methods for registries
- Page 147 and 148: Statistical methods for registries
- Page 149 and 150: Statistical methods for registries
- Page 151 and 152: Statistical methods for registries
- Page 153 and 154: Statistical methods for registries
- Page 155 and 156: Statistical methods for registries
- Page 157 and 158: Statistical methods for registries
- Page 159 and 160: Statistical methods for registries
- Page 161 and 162: Statistical methods for registries
- Page 163 and 164: Statistical methods for registries
- Page 165 and 166: Chapter 12. Analysis of survival D.
- Page 167 and 168: Passive follow-up Analysis of survi
- Page 169 and 170: Analysis of survival Table 1 - cont
- Page 171 and 172: Table 2. Calculation of observed su
- Page 173 and 174: Table 3. Calculation of the correct
- Page 175 and 176: Analysis of survival 169 Table 4. C
- Page 177 and 178: Analysis of survival 171 In the cal
- Page 179 and 180:
Analysis of survival 1 73 Table 6.
- Page 181 and 182:
Analysis of survival Deaths : cases
- Page 183 and 184:
Chapter 13. The hospital-based canc
- Page 185 and 186:
The hospital-based cancer registry
- Page 187 and 188:
The hospital-based cancer registry
- Page 189 and 190:
The hospital-based cancer registry
- Page 191 and 192:
Chapter 14. Cancer registration in
- Page 193 and 194:
Cancer registration in developing c
- Page 195 and 196:
Cancer registration in developing c
- Page 197 and 198:
Cancer registration in developing c
- Page 199 and 200:
Cancer registration in developing c
- Page 201 and 202:
Cancer registration in developing c
- Page 203 and 204:
Cancer registration in developing c
- Page 205 and 206:
Chapter 15. Cancer registration: le
- Page 207 and 208:
Cancer registration: legal aspects
- Page 209 and 210:
Computer Cancer registration : lega
- Page 211 and 212:
Cancer registration: legal aspects
- Page 213 and 214:
Cancer registration : legal aspects
- Page 215 and 216:
Appendix I Botswana Brazil British
- Page 217 and 218:
Appendix 1 Sri Lanka Sudan Suriname
- Page 219 and 220:
Appendix 2 213 Some of these edits
- Page 221 and 222:
Appendix 2 Table 1 - continued (Not
- Page 223 and 224:
Table 2. Example of a SEER site/his
- Page 225 and 226:
- Appendix 2 219 Follow-up status (
- Page 227 and 228:
Appendix 3(a) 221 (c) statistics on
- Page 229 and 230:
Appendix 3(a) 223 presence of tumou
- Page 231 and 232:
Appendix 3(a) the hospital record.
- Page 233 and 234:
Appendix 3(a) 227 REVERSE SIDE OF N
- Page 235 and 236:
Appendix 3(a) REVERSE SIDE OF NOTIF
- Page 237 and 238:
Data from CPR, i.e. vital Warning o
- Page 239 and 240:
Appendix 3(a) 233 place of residenc
- Page 241 and 242:
Appendix 3(a) 235 maintained for ta
- Page 243 and 244:
Appendix 3 (b) The Thames Cancer Re
- Page 245 and 246:
SURGERY Appendix 3(b) TREATMENT OF
- Page 247 and 248:
Appendix 3(b) 241 supervised by the
- Page 249 and 250:
Appendix 3(b) 243 first for direct
- Page 251 and 252:
Appendix 3(b) 245 maintaining an ef
- Page 253 and 254:
Appendix 3(c) 247 information on ca
- Page 255 and 256:
Appendix 3(c) 249 Pathology reports
- Page 257 and 258:
Appendix 3(c) HOSPITAL DISCHARGES L
- Page 259 and 260:
Appendix 3(c) Table 1. Groupings of
- Page 261 and 262:
Appendix 3(c) 255 several sources a
- Page 263 and 264:
Appendix 3(c) 257 resulted in a can
- Page 265 and 266:
Appendix 3(d) medical records (in-p
- Page 267 and 268:
Appendix 3(d) MOST VALID BASIS OF D
- Page 269 and 270:
Appendix 3(d) 263 -malignancies usu
- Page 271 and 272:
Appendix 3(d) abstract. For recorde
- Page 273 and 274:
Appendix 4. CANREG: Cancer registra
- Page 275 and 276:
Appendix 4 Table 1. CANREG internal
- Page 277 and 278:
Appendix 4 271 0 Page 1 Patient Nam
- Page 279 and 280:
Appendix 4 273 -an operating system
- Page 281 and 282:
References Acheson, E. D. (1967) Me
- Page 283 and 284:
References 277 oncology services. T
- Page 285 and 286:
References International Agency for
- Page 287 and 288:
References 281 Official Statistics
- Page 289 and 290:
References 283 Sieveking, G. H. (19
- Page 291 and 292:
Subject Index Access to data, 202,
- Page 293 and 294:
Subject Index International Classif