Cancer Registration: Principles and Methods - IARC
Cancer Registration: Principles and Methods - IARC
Cancer Registration: Principles and Methods - IARC
You also want an ePaper? Increase the reach of your titles
YUMPU automatically turns print PDFs into web optimized ePapers that Google loves.
138 P. Boyle <strong>and</strong> D.M. Parkin<br />
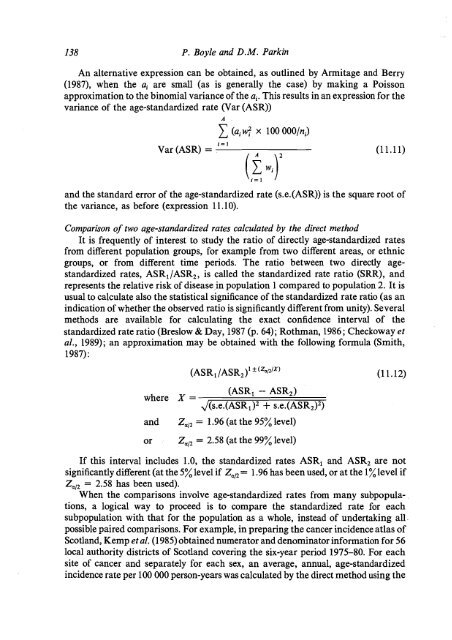
An alternative expression can be obtained, as outlined by Armitage <strong>and</strong> Berry<br />
(1987), when the a, are small (as is generally the case) by making a Poisson<br />
approximation to the binomial variance of the a,. This results in an expression for the<br />
variance of the age-st<strong>and</strong>ardized rate (Var (ASR))<br />
Var (ASR) =<br />
A<br />
C (a, 4 x 100 OOO/nJ<br />
i= 1<br />
/ A \2<br />
<strong>and</strong> the st<strong>and</strong>ard error of the age-st<strong>and</strong>ardized rate (s.e.(ASR)) is the square root of<br />
the variance, as before (expression 1 1.10).<br />
Comparison of two age-st<strong>and</strong>ardized rates calculated by the direct method<br />
It is frequently of interest to study the ratio of directly age-st<strong>and</strong>ardized rates<br />
from different population groups, for example from two different areas, or ethnic<br />
groups, or from different time periods. The ratio between two directly agest<strong>and</strong>ardized<br />
rates, ASR,/ASR2, is called the st<strong>and</strong>ardized rate ratio (SRR), <strong>and</strong><br />
represents the relative risk of disease in population 1 compared to population 2. It is<br />
usual to calculate also the statistical significance of the st<strong>and</strong>ardized rate ratio (as an<br />
indication of whether the observed ratio is significantly different from unity). Several<br />
methods are available for calculating the exact confidence interval of the<br />
st<strong>and</strong>ardized rate ratio (Breslow & Day, 1987 (p. 64); Rothrnan, 1986; Checkoway et<br />
al., 1989); an approximation may be obtained with the following formula (Smith,<br />
1987) :<br />
(ASR, - ASR2)<br />
where X =<br />
J(S.~.(ASR,)~ + S.~.(ASR~)~)<br />
<strong>and</strong><br />
or .<br />
Za,,=1.96(atthe95%level)<br />
ZaI2 = 2.58 (at the 99% level)<br />
If this interval includes 1.0, the st<strong>and</strong>ardized rates ASR, <strong>and</strong> ASR2 are not<br />
significantly different (at the 5% level if ZaI2 = 1.96 has been used, or at the 1% level if<br />
ZaI2 = 2.58 has been used).<br />
When the comparisons involve age-st<strong>and</strong>ardized rates from many subpopulations,<br />
a logical way to proceed is to compare the st<strong>and</strong>ardized rate for each<br />
subpopulation with that for the population as a whole, instead of undertaking all<br />
possible paired comparisons. For example, in preparing the cancer incidence atlas of<br />
Scotl<strong>and</strong>, Kemp et al. (1 985) obtained numerator <strong>and</strong> denominator information for 56<br />
local authority districts of Scotl<strong>and</strong> covering the six-year period 1975-80. For each<br />
site of cancer <strong>and</strong> separately for each sex, an average, annual, age-st<strong>and</strong>ardized<br />
incidence rate per 100 000 person-years was calculated by the direct method using the


