Adoption of Improved Sorghum and Pearl Millet ... - Icrisat
Adoption of Improved Sorghum and Pearl Millet ... - Icrisat
Adoption of Improved Sorghum and Pearl Millet ... - Icrisat

Create successful ePaper yourself
Turn your PDF publications into a flip-book with our unique Google optimized e-Paper software.
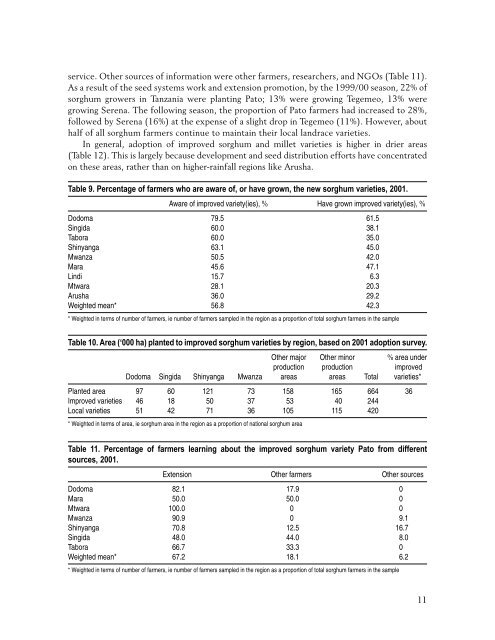
service. Other sources <strong>of</strong> information were other farmers, researchers, <strong>and</strong> NGOs (Table 11).<br />
As a result <strong>of</strong> the seed systems work <strong>and</strong> extension promotion, by the 1999/00 season, 22% <strong>of</strong><br />
sorghum growers in Tanzania were planting Pato; 13% were growing Tegemeo, 13% were<br />
growing Serena. The following season, the proportion <strong>of</strong> Pato farmers had increased to 28%,<br />
followed by Serena (16%) at the expense <strong>of</strong> a slight drop in Tegemeo (11%). However, about<br />
half <strong>of</strong> all sorghum farmers continue to maintain their local l<strong>and</strong>race varieties.<br />
In general, adoption <strong>of</strong> improved sorghum <strong>and</strong> millet varieties is higher in drier areas<br />
(Table 12). This is largely because development <strong>and</strong> seed distribution efforts have concentrated<br />
on these areas, rather than on higher-rainfall regions like Arusha.<br />
Table 9. Percentage <strong>of</strong> farmers who are aware <strong>of</strong>, or have grown, the new sorghum varieties, 2001.<br />
Aware <strong>of</strong> improved variety(ies), % Have grown improved variety(ies), %<br />
Dodoma 79.5 61.5<br />
Singida 60.0 38.1<br />
Tabora 60.0 35.0<br />
Shinyanga 63.1 45.0<br />
Mwanza 50.5 42.0<br />
Mara 45.6 47.1<br />
Lindi 15.7 6.3<br />
Mtwara 28.1 20.3<br />
Arusha 36.0 29.2<br />
Weighted mean* 56.8 42.3<br />
* Weighted in terms <strong>of</strong> number <strong>of</strong> farmers, ie number <strong>of</strong> farmers sampled in the region as a proportion <strong>of</strong> total sorghum farmers in the sample<br />
Table 10. Area (‘000 ha) planted to improved sorghum varieties by region, based on 2001 adoption survey.<br />
Other major Other minor % area under<br />
production production improved<br />
Dodoma Singida Shinyanga Mwanza areas areas Total varieties*<br />
Planted area 97 60 121 73 158 165 664 36<br />
<strong>Improved</strong> varieties 46 18 50 37 53 40 244<br />
Local varieties 51 42 71 36 105 115 420<br />
* Weighted in terms <strong>of</strong> area, ie sorghum area in the region as a proportion <strong>of</strong> national sorghum area<br />
Table 11. Percentage <strong>of</strong> farmers learning about the improved sorghum variety Pato from different<br />
sources, 2001.<br />
Extension Other farmers Other sources<br />
Dodoma 82.1 17.9 0<br />
Mara 50.0 50.0 0<br />
Mtwara 100.0 0 0<br />
Mwanza 90.9 0 9.1<br />
Shinyanga 70.8 12.5 16.7<br />
Singida 48.0 44.0 8.0<br />
Tabora 66.7 33.3 0<br />
Weighted mean* 67.2 18.1 6.2<br />
* Weighted in terms <strong>of</strong> number <strong>of</strong> farmers, ie number <strong>of</strong> farmers sampled in the region as a proportion <strong>of</strong> total sorghum farmers in the sample<br />
11