

Predicting Wetland Plant Community Responses to ... - BioOne
Predicting Wetland Plant Community Responses to ... - BioOne
Predicting Wetland Plant Community Responses to ... - BioOne

Create successful ePaper yourself
Turn your PDF publications into a flip-book with our unique Google optimized e-Paper software.
Modeling <strong>Wetland</strong> Response <strong>to</strong> Regulation of Lake Ontario Water Levels 763<br />
are between 75.00 m and 75.50 m. However, the SD<br />
values are much lower (around or slightly higher<br />
than 5.00) than those of the drowned river mouth<br />
model. The generalized model for protected embayment<br />
wetlands only has three elevation zones that<br />
have high area percentages. The three zones span<br />
73.75–74.00 m, 74.00–74.25 m, and 75.25–75.50 m.<br />
The corresponding SD values are also much higher,<br />
reaching 15.22. Moreover, there are three zones that<br />
have lower area percentages but higher SD values<br />
(74.75–75.00 m, 75.00–75.25 m, 75.50–75.75 m).<br />
The generalized model for barrier beach wetlands<br />
has three consecutively highly concentrated zones,<br />
which are located in the upper portions between<br />
75.00 and 75.75 m. The SD values are quite high<br />
also. Moreover, the 74.50–74.75 m elevation zone<br />
has a very high SD value.<br />
When compared, the four wetland geometric<br />
models are distinct in terms of percent area distributions<br />
along the model elevation profiles. Within<br />
the open and protected embayment geometric models,<br />
lower elevation portions account for more of<br />
the <strong>to</strong>tal model area. Relative <strong>to</strong> the other wetland<br />
types, the open embayment wetlands are more exposed<br />
<strong>to</strong> wave attack and ice scour, which reduces<br />
the amount of organic sediment deposition. For this<br />
reason, the open embayment wetlands are expected<br />
<strong>to</strong> have a steeper <strong>to</strong>pographic profile within the<br />
upper con<strong>to</strong>ur elevations and shallower slopes at<br />
lower elevation con<strong>to</strong>urs. The open embayment<br />
wetlands are more regularly shaped, and thus, the<br />
open embayment geometric model is more stable<br />
and predictable. However, the protected embayment<br />
model seems <strong>to</strong> be very sensitive <strong>to</strong> the protection,<br />
which depends on coastal shorelines and geomorphologic<br />
conditions. The study wetlands displayed<br />
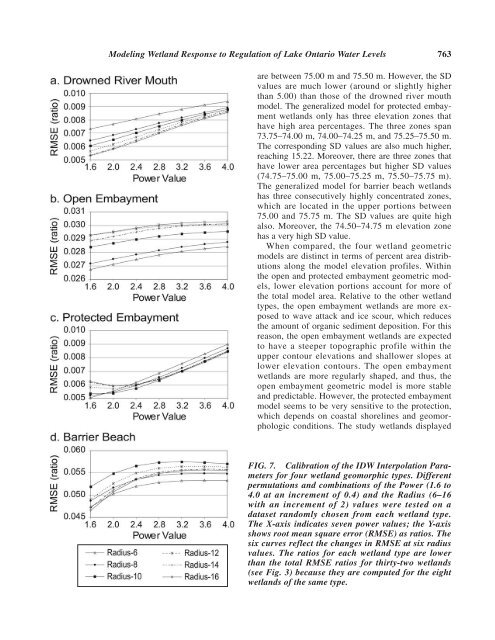
FIG. 7. Calibration of the IDW Interpolation Parameters<br />
for four wetland geomorphic types. Different<br />
permutations and combinations of the Power (1.6 <strong>to</strong><br />
4.0 at an increment of 0.4) and the Radius (6–16<br />
with an increment of 2) values were tested on a<br />
dataset randomly chosen from each wetland type.<br />
The X-axis indicates seven power values; the Y-axis<br />
shows root mean square error (RMSE) as ratios. The<br />
six curves reflect the changes in RMSE at six radius<br />
values. The ratios for each wetland type are lower<br />
than the <strong>to</strong>tal RMSE ratios for thirty-two wetlands<br />
(see Fig. 3) because they are computed for the eight<br />
wetlands of the same type.


