

Predicting Wetland Plant Community Responses to ... - BioOne
Predicting Wetland Plant Community Responses to ... - BioOne
Predicting Wetland Plant Community Responses to ... - BioOne

You also want an ePaper? Increase the reach of your titles
YUMPU automatically turns print PDFs into web optimized ePapers that Google loves.
Modeling <strong>Wetland</strong> Response <strong>to</strong> Regulation of Lake Ontario Water Levels 771<br />
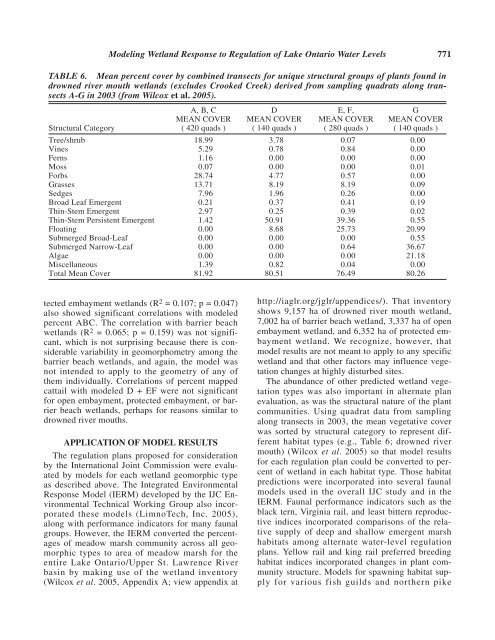
TABLE 6. Mean percent cover by combined transects for unique structural groups of plants found in<br />
drowned river mouth wetlands (excludes Crooked Creek) derived from sampling quadrats along transects<br />
A-G in 2003 (from Wilcox et al. 2005).<br />
A, B, C D E, F, G<br />
MEAN COVER MEAN COVER MEAN COVER MEAN COVER<br />
Structural Category ( 420 quads ) ( 140 quads ) ( 280 quads ) ( 140 quads )<br />
Tree/shrub 18.99 3.78 0.07 0.00<br />
Vines 5.29 0.78 0.84 0.00<br />
Ferns 1.16 0.00 0.00 0.00<br />
Moss 0.07 0.00 0.00 0.01<br />
Forbs 28.74 4.77 0.57 0.00<br />
Grasses 13.71 8.19 8.19 0.09<br />
Sedges 7.96 1.96 0.26 0.00<br />
Broad Leaf Emergent 0.21 0.37 0.41 0.19<br />
Thin-Stem Emergent 2.97 0.25 0.39 0.02<br />
Thin-Stem Persistent Emergent 1.42 50.91 39.36 0.55<br />
Floating 0.00 8.68 25.73 20.99<br />
Submerged Broad-Leaf 0.00 0.00 0.00 0.55<br />
Submerged Narrow-Leaf 0.00 0.00 0.64 36.67<br />
Algae 0.00 0.00 0.00 21.18<br />
Miscellaneous 1.39 0.82 0.04 0.00<br />
Total Mean Cover 81.92 80.51 76.49 80.26<br />
tected embayment wetlands (R 2 = 0.107; p = 0.047)<br />
also showed significant correlations with modeled<br />
percent ABC. The correlation with barrier beach<br />
wetlands (R 2 = 0.065; p = 0.159) was not significant,<br />
which is not surprising because there is considerable<br />
variability in geomorphometry among the<br />
barrier beach wetlands, and again, the model was<br />
not intended <strong>to</strong> apply <strong>to</strong> the geometry of any of<br />
them individually. Correlations of percent mapped<br />
cattail with modeled D + EF were not significant<br />
for open embayment, protected embayment, or barrier<br />
beach wetlands, perhaps for reasons similar <strong>to</strong><br />
drowned river mouths.<br />
APPLICATION OF MODEL RESULTS<br />
The regulation plans proposed for consideration<br />
by the International Joint Commission were evaluated<br />
by models for each wetland geomorphic type<br />
as described above. The Integrated Environmental<br />
Response Model (IERM) developed by the IJC Environmental<br />
Technical Working Group also incorporated<br />
these models (LimnoTech, Inc. 2005),<br />
along with performance indica<strong>to</strong>rs for many faunal<br />
groups. However, the IERM converted the percentages<br />
of meadow marsh community across all geomorphic<br />
types <strong>to</strong> area of meadow marsh for the<br />
entire Lake Ontario/Upper St. Lawrence River<br />
basin by making use of the wetland inven<strong>to</strong>ry<br />
(Wilcox et al. 2005, Appendix A; view appendix at<br />
http://iaglr.org/jglr/appendices/). That inven<strong>to</strong>ry<br />
shows 9,157 ha of drowned river mouth wetland,<br />
7,002 ha of barrier beach wetland, 3,337 ha of open<br />
embayment wetland, and 6,352 ha of protected embayment<br />
wetland. We recognize, however, that<br />
model results are not meant <strong>to</strong> apply <strong>to</strong> any specific<br />
wetland and that other fac<strong>to</strong>rs may influence vegetation<br />
changes at highly disturbed sites.<br />
The abundance of other predicted wetland vegetation<br />
types was also important in alternate plan<br />
evaluation, as was the structural nature of the plant<br />
communities. Using quadrat data from sampling<br />
along transects in 2003, the mean vegetative cover<br />
was sorted by structural category <strong>to</strong> represent different<br />
habitat types (e.g., Table 6; drowned river<br />
mouth) (Wilcox et al. 2005) so that model results<br />
for each regulation plan could be converted <strong>to</strong> percent<br />
of wetland in each habitat type. Those habitat<br />
predictions were incorporated in<strong>to</strong> several faunal<br />
models used in the overall IJC study and in the<br />
IERM. Faunal performance indica<strong>to</strong>rs such as the<br />
black tern, Virginia rail, and least bittern reproductive<br />
indices incorporated comparisons of the relative<br />
supply of deep and shallow emergent marsh<br />
habitats among alternate water-level regulation<br />
plans. Yellow rail and king rail preferred breeding<br />
habitat indices incorporated changes in plant community<br />
structure. Models for spawning habitat supply<br />
for various fish guilds and northern pike


