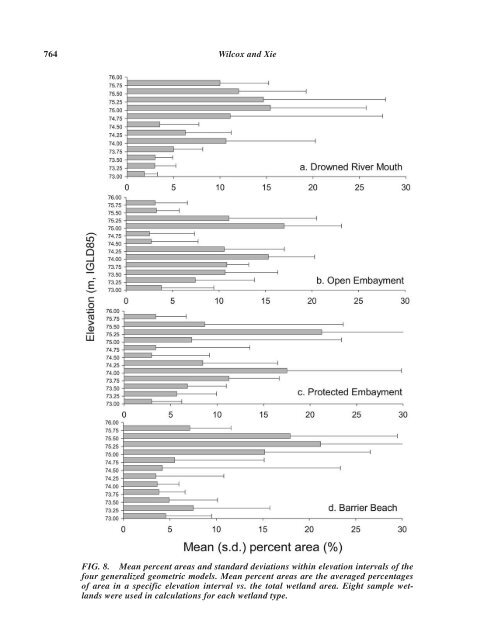
764 Wilcox and Xie FIG. 8. Mean percent areas and standard deviations within elevation intervals of the four generalized geometric models. Mean percent areas are the averaged percentages of area in a specific elevation interval vs. the <strong>to</strong>tal wetland area. Eight sample wetlands were used in calculations for each wetland type.
Modeling <strong>Wetland</strong> Response <strong>to</strong> Regulation of Lake Ontario Water Levels 765 obvious deviations in the area percents from the mean. Drowned river mouth and barrier beach wetlands are typically well-protected from wave attack. The protection features allow for thick sediment accumulation and result in a shallower <strong>to</strong>pographic profile within the upper elevation con<strong>to</strong>urs of the model range (Wilcox et al. 2005). In the context of model sensitivity, the drowned river mouth model performed relatively stably. The barrier beach model showed large fluctuations. AN ILLUSTRATION USING THE PREDICTIVE MODELS TO ASSESS ALTERNATIVE WATER REGULATION PLANS The predictive models for each of the four wetland geomorphic types were tested using potential regulation plans for Lake Ontario. The plans tested were the current Plan 1958D with deviations (1958DD) and two plans (X and Y) developed by using 1958DD as a base. The differences in lake level among any proposed regulation plans are dictated by how much water is released <strong>to</strong> the lower St. Lawrence River under any given net basin supply (the amount of water entering Lake Ontario from its immediate watershed and from the upper Great Lakes). Plans X and Y simulated releasing more water <strong>to</strong> the lower river than did 1958DD in 1900–1903, the 1920s, 1930s–early 1940s, 1960s, and late 1990s when basin supplies were low (IJC data), thus resulting in more years with low lake levels. More years with low levels were added in Plan Y than in Plan X (Fig. 9). The low lake levels added <strong>to</strong> Plan 1958DD were never lower than those that actually occurred during post-regulation; high lake levels never exceeded those of 1958DD. Based on existing knowledge of moisture requirements of the plant species involved, as well as observations and data from the Lake Ontario studies, testing of these plans should show an increase in area of meadow marsh (ABC) and a decrease in cattail (EF) vegetation as more low lake levels are added. Predictions for Plan Y Using Drowned River Mouth <strong>Wetland</strong> Model As an illustration of the model procedures, we present the results for testing the drowned river mouth wetland model using hydrologic input data from the test Plan Y, along with details regarding each step in the process. First, we summarize the results of data analyses from quantitative sampling of plant communities. Analysis of NMDS ordinations and mean percent cover data for the most prominent species identified four distinct plant communities—ABC, D, EF, and G (Wilcox et al. 2005). Transects A, B, and C were quite similar in species composition, with sedges, grasses, and some upland species. In transect D, these sedges, grasses, and the cattails present in EF comprised the prominent species. Transects E and F were largely dominated by cattails, with some submersed species and a few sedges and grasses. In transect G, submersed and floating-leaf vegetation (e.g., water lilies) were much more prominent than emergent vegetation, and sedges and grasses were not observed. The demarcation between the EF and G vegetation types at the study sites was typically very distinct. Although we did not sample elevations above 75.72 m that had not been flooded for more than 30 years due <strong>to</strong> the constraints imposed by actual past lake levels, we recognized that they were still within the potential range of extreme high Lake Ontario water levels. The plant communities at those unflooded elevations showed strong transition <strong>to</strong> upland vegetation and were given a separate category (U). Similar actual lake-level constraints, as well as shallower basins, prevented sampling at lower elevations that had not been dewatered for more than 68 years; however, on-site observations suggested that transect G represented those areas well. Based on past flooding/dewatering his<strong>to</strong>ry that resulted in these five communities, we set the following rules and procedures for assigning vegetation types <strong>to</strong> portions of the drowned river mouth geometric model (not individual sites) in any given year in a regulation plan. Professional judgment based on discussions among prominent Great Lakes wetland scientists was used <strong>to</strong> determine break points between some classes. 1. Elevations above the highest peak in the entire regulation plan: assign <strong>to</strong> U (transition <strong>to</strong> Upland) and go up <strong>to</strong> elevation of 75.75 m (<strong>to</strong>p of model) 2. For other peak lake levels used <strong>to</strong> make “last flooded” determinations, use lowest of four adjacent quarter-month values (including peak). Starting with the next highest lake level following the highest peak and then moving sequentially <strong>to</strong> each more recent peak value, assign vegetation types as follows.