

Predicting Wetland Plant Community Responses to ... - BioOne
Predicting Wetland Plant Community Responses to ... - BioOne
Predicting Wetland Plant Community Responses to ... - BioOne

Create successful ePaper yourself
Turn your PDF publications into a flip-book with our unique Google optimized e-Paper software.
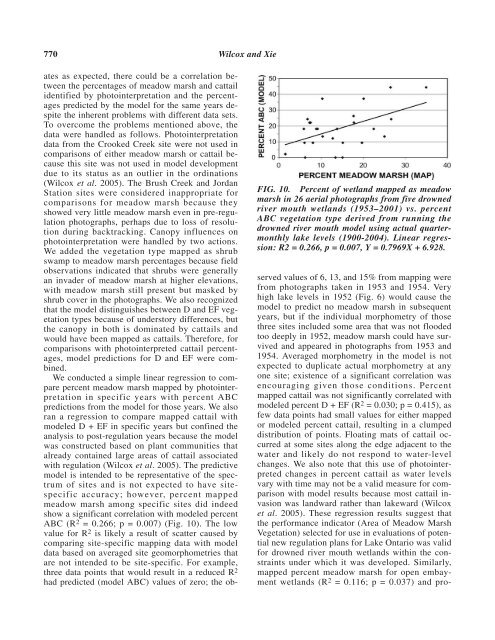
770 Wilcox and Xie<br />
FIG. 10. Percent of wetland mapped as meadow<br />
marsh in 26 aerial pho<strong>to</strong>graphs from five drowned<br />
river mouth wetlands (1953–2001) vs. percent<br />
ABC vegetation type derived from running the<br />
drowned river mouth model using actual quartermonthly<br />
lake levels (1900-2004). Linear regression:<br />
R2 = 0.266, p = 0.007, Y = 0.7969X + 6.928.<br />
ates as expected, there could be a correlation between<br />
the percentages of meadow marsh and cattail<br />
identified by pho<strong>to</strong>interpretation and the percentages<br />
predicted by the model for the same years despite<br />
the inherent problems with different data sets.<br />
To overcome the problems mentioned above, the<br />
data were handled as follows. Pho<strong>to</strong>interpretation<br />
data from the Crooked Creek site were not used in<br />
comparisons of either meadow marsh or cattail because<br />
this site was not used in model development<br />
due <strong>to</strong> its status as an outlier in the ordinations<br />
(Wilcox et al. 2005). The Brush Creek and Jordan<br />
Station sites were considered inappropriate for<br />
comparisons for meadow marsh because they<br />
showed very little meadow marsh even in pre-regulation<br />
pho<strong>to</strong>graphs, perhaps due <strong>to</strong> loss of resolution<br />
during backtracking. Canopy influences on<br />
pho<strong>to</strong>interpretation were handled by two actions.<br />
We added the vegetation type mapped as shrub<br />
swamp <strong>to</strong> meadow marsh percentages because field<br />
observations indicated that shrubs were generally<br />
an invader of meadow marsh at higher elevations,<br />
with meadow marsh still present but masked by<br />
shrub cover in the pho<strong>to</strong>graphs. We also recognized<br />
that the model distinguishes between D and EF vegetation<br />
types because of unders<strong>to</strong>ry differences, but<br />
the canopy in both is dominated by cattails and<br />
would have been mapped as cattails. Therefore, for<br />
comparisons with pho<strong>to</strong>interpreted cattail percentages,<br />
model predictions for D and EF were combined.<br />
We conducted a simple linear regression <strong>to</strong> compare<br />
percent meadow marsh mapped by pho<strong>to</strong>interpretation<br />
in specific years with percent ABC<br />
predictions from the model for those years. We also<br />
ran a regression <strong>to</strong> compare mapped cattail with<br />
modeled D + EF in specific years but confined the<br />
analysis <strong>to</strong> post-regulation years because the model<br />
was constructed based on plant communities that<br />
already contained large areas of cattail associated<br />
with regulation (Wilcox et al. 2005). The predictive<br />
model is intended <strong>to</strong> be representative of the spectrum<br />
of sites and is not expected <strong>to</strong> have sitespecific<br />
accuracy; however, percent mapped<br />
meadow marsh among specific sites did indeed<br />
show a significant correlation with modeled percent<br />
ABC (R 2 = 0.266; p = 0.007) (Fig. 10). The low<br />
value for R 2 is likely a result of scatter caused by<br />
comparing site-specific mapping data with model<br />
data based on averaged site geomorphometries that<br />
are not intended <strong>to</strong> be site-specific. For example,<br />
three data points that would result in a reduced R 2<br />
had predicted (model ABC) values of zero; the observed<br />
values of 6, 13, and 15% from mapping were<br />
from pho<strong>to</strong>graphs taken in 1953 and 1954. Very<br />
high lake levels in 1952 (Fig. 6) would cause the<br />
model <strong>to</strong> predict no meadow marsh in subsequent<br />
years, but if the individual morphometry of those<br />
three sites included some area that was not flooded<br />
<strong>to</strong>o deeply in 1952, meadow marsh could have survived<br />
and appeared in pho<strong>to</strong>graphs from 1953 and<br />
1954. Averaged morphometry in the model is not<br />
expected <strong>to</strong> duplicate actual morphometry at any<br />
one site; existence of a significant correlation was<br />
encouraging given those conditions. Percent<br />
mapped cattail was not significantly correlated with<br />
modeled percent D + EF (R 2 = 0.030; p = 0.415), as<br />
few data points had small values for either mapped<br />
or modeled percent cattail, resulting in a clumped<br />
distribution of points. Floating mats of cattail occurred<br />
at some sites along the edge adjacent <strong>to</strong> the<br />
water and likely do not respond <strong>to</strong> water-level<br />
changes. We also note that this use of pho<strong>to</strong>interpreted<br />
changes in percent cattail as water levels<br />
vary with time may not be a valid measure for comparison<br />
with model results because most cattail invasion<br />
was landward rather than lakeward (Wilcox<br />
et al. 2005). These regression results suggest that<br />
the performance indica<strong>to</strong>r (Area of Meadow Marsh<br />
Vegetation) selected for use in evaluations of potential<br />
new regulation plans for Lake Ontario was valid<br />
for drowned river mouth wetlands within the constraints<br />
under which it was developed. Similarly,<br />
mapped percent meadow marsh for open embayment<br />
wetlands (R 2 = 0.116; p = 0.037) and pro-


