

Predicting Wetland Plant Community Responses to ... - BioOne
Predicting Wetland Plant Community Responses to ... - BioOne
Predicting Wetland Plant Community Responses to ... - BioOne

Create successful ePaper yourself
Turn your PDF publications into a flip-book with our unique Google optimized e-Paper software.
Modeling <strong>Wetland</strong> Response <strong>to</strong> Regulation of Lake Ontario Water Levels 769<br />
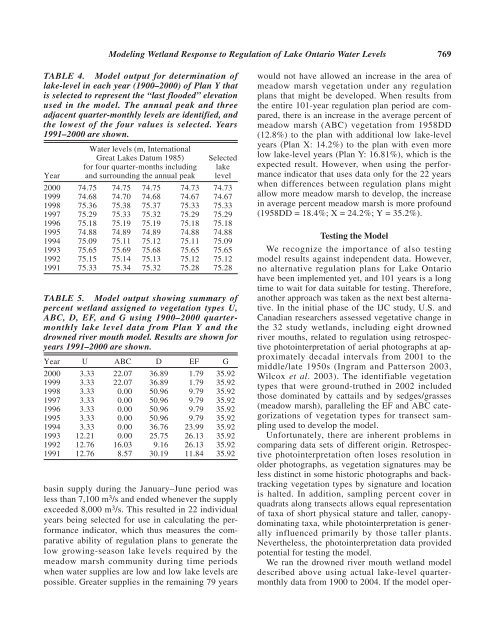
TABLE 4. Model output for determination of<br />
lake-level in each year (1900–2000) of Plan Y that<br />
is selected <strong>to</strong> represent the “last flooded” elevation<br />
used in the model. The annual peak and three<br />
adjacent quarter-monthly levels are identified, and<br />
the lowest of the four values is selected. Years<br />
1991–2000 are shown.<br />
Water levels (m, International<br />
Great Lakes Datum 1985) Selected<br />
for four quarter-months including lake<br />
Year and surrounding the annual peak level<br />
2000 74.75 74.75 74.75 74.73 74.73<br />
1999 74.68 74.70 74.68 74.67 74.67<br />
1998 75.36 75.38 75.37 75.33 75.33<br />
1997 75.29 75.33 75.32 75.29 75.29<br />
1996 75.18 75.19 75.19 75.18 75.18<br />
1995 74.88 74.89 74.89 74.88 74.88<br />
1994 75.09 75.11 75.12 75.11 75.09<br />
1993 75.65 75.69 75.68 75.65 75.65<br />
1992 75.15 75.14 75.13 75.12 75.12<br />
1991 75.33 75.34 75.32 75.28 75.28<br />
TABLE 5. Model output showing summary of<br />
percent wetland assigned <strong>to</strong> vegetation types U,<br />
ABC, D, EF, and G using 1900–2000 quartermonthly<br />
lake level data from Plan Y and the<br />
drowned river mouth model. Results are shown for<br />
years 1991–2000 are shown.<br />
Year U ABC D EF G<br />
2000 3.33 22.07 36.89 1.79 35.92<br />
1999 3.33 22.07 36.89 1.79 35.92<br />
1998 3.33 0.00 50.96 9.79 35.92<br />
1997 3.33 0.00 50.96 9.79 35.92<br />
1996 3.33 0.00 50.96 9.79 35.92<br />
1995 3.33 0.00 50.96 9.79 35.92<br />
1994 3.33 0.00 36.76 23.99 35.92<br />
1993 12.21 0.00 25.75 26.13 35.92<br />
1992 12.76 16.03 9.16 26.13 35.92<br />
1991 12.76 8.57 30.19 11.84 35.92<br />
basin supply during the January–June period was<br />
less than 7,100 m 3 /s and ended whenever the supply<br />
exceeded 8,000 m 3 /s. This resulted in 22 individual<br />
years being selected for use in calculating the performance<br />
indica<strong>to</strong>r, which thus measures the comparative<br />
ability of regulation plans <strong>to</strong> generate the<br />
low growing-season lake levels required by the<br />
meadow marsh community during time periods<br />
when water supplies are low and low lake levels are<br />
possible. Greater supplies in the remaining 79 years<br />
would not have allowed an increase in the area of<br />
meadow marsh vegetation under any regulation<br />
plans that might be developed. When results from<br />
the entire 101-year regulation plan period are compared,<br />
there is an increase in the average percent of<br />
meadow marsh (ABC) vegetation from 1958DD<br />
(12.8%) <strong>to</strong> the plan with additional low lake-level<br />
years (Plan X: 14.2%) <strong>to</strong> the plan with even more<br />
low lake-level years (Plan Y: 16.81%), which is the<br />
expected result. However, when using the performance<br />
indica<strong>to</strong>r that uses data only for the 22 years<br />
when differences between regulation plans might<br />
allow more meadow marsh <strong>to</strong> develop, the increase<br />
in average percent meadow marsh is more profound<br />
(1958DD = 18.4%; X = 24.2%; Y = 35.2%).<br />
Testing the Model<br />
We recognize the importance of also testing<br />
model results against independent data. However,<br />
no alternative regulation plans for Lake Ontario<br />
have been implemented yet, and 101 years is a long<br />
time <strong>to</strong> wait for data suitable for testing. Therefore,<br />
another approach was taken as the next best alternative.<br />
In the initial phase of the IJC study, U.S. and<br />
Canadian researchers assessed vegetative change in<br />
the 32 study wetlands, including eight drowned<br />
river mouths, related <strong>to</strong> regulation using retrospective<br />
pho<strong>to</strong>interpretation of aerial pho<strong>to</strong>graphs at approximately<br />
decadal intervals from 2001 <strong>to</strong> the<br />
middle/late 1950s (Ingram and Patterson 2003,<br />
Wilcox et al. 2003). The identifiable vegetation<br />
types that were ground-truthed in 2002 included<br />
those dominated by cattails and by sedges/grasses<br />
(meadow marsh), paralleling the EF and ABC categorizations<br />
of vegetation types for transect sampling<br />
used <strong>to</strong> develop the model.<br />
Unfortunately, there are inherent problems in<br />
comparing data sets of different origin. Retrospective<br />
pho<strong>to</strong>interpretation often loses resolution in<br />
older pho<strong>to</strong>graphs, as vegetation signatures may be<br />
less distinct in some his<strong>to</strong>ric pho<strong>to</strong>graphs and backtracking<br />
vegetation types by signature and location<br />
is halted. In addition, sampling percent cover in<br />
quadrats along transects allows equal representation<br />
of taxa of short physical stature and taller, canopydominating<br />
taxa, while pho<strong>to</strong>interpretation is generally<br />
influenced primarily by those taller plants.<br />
Nevertheless, the pho<strong>to</strong>interpretation data provided<br />
potential for testing the model.<br />
We ran the drowned river mouth wetland model<br />
described above using actual lake-level quartermonthly<br />
data from 1900 <strong>to</strong> 2004. If the model oper-


