

US-Listed ETFs Sorted by Asset Class and Year-to-Date Return
US-Listed ETFs Sorted by Asset Class and Year-to-Date Return
US-Listed ETFs Sorted by Asset Class and Year-to-Date Return

You also want an ePaper? Increase the reach of your titles
YUMPU automatically turns print PDFs into web optimized ePapers that Google loves.
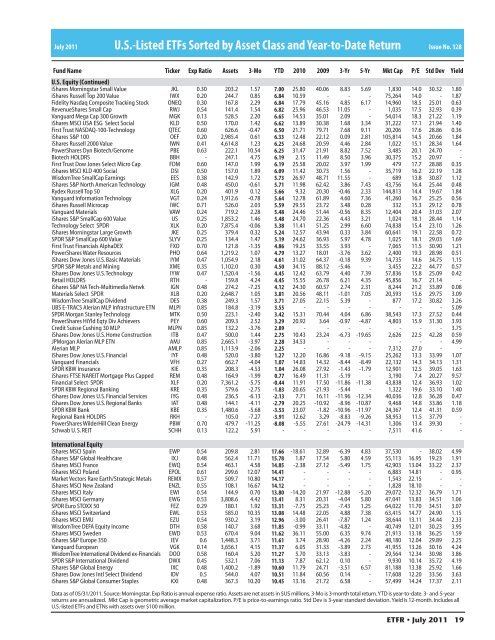
July 2011 U.S.-<strong>Listed</strong> <strong>ETFs</strong> <strong>Sorted</strong> <strong>by</strong> <strong>Asset</strong> <strong>Class</strong> <strong>and</strong> <strong>Year</strong>-<strong>to</strong>-<strong>Date</strong> <strong>Return</strong><br />
Issue No. 128<br />
Fund Name Ticker Exp Ratio <strong>Asset</strong>s 3-Mo YTD 2010 2009 3-Yr 5-Yr Mkt Cap P/E Std Dev<br />
U.S. Equity (Continued)<br />
0.30 203.2 1.57 7.00 25.80 40.06 8.83 5.69 1,830 14.0 30.32 1.80<br />
IWX 0.20 244.7 0.85 6.84 10.59 - - - 75,264 14.0 - 1.87<br />
0.30 167.8 2.29 6.84 17.79 45.16 4.85 6.17 14,960 18.5 25.01 0.63<br />
RWJ 0.54 141.4 1.54 6.82 25.96 46.53 11.05 - 1,035 17.5 32.93 0.39<br />
0.13 528.5 2.20 6.65 14.53 35.01 2.09 - 54,014 18.3 21.22 1.19<br />
0.50 170.0 1.42 6.62 13.89 30.38 1.68 3.34 31,222 17.1 21.94 1.40<br />
0.60 626.6 -0.47 6.50 21.71 79.71 7.68 9.11 20,206 17.6 28.86 0.36<br />
iShares S&P 100 0.20 2,985.4 0.61 6.33 12.48 22.12 0.09 2.81 105,814 14.5 20.66 1.84<br />
iShares Russell 2000 Value 0.41 4,614.8 1.23 6.25 24.68 20.59 4.46 2.84 1,022 15.1 28.34 1.64<br />
0.63 222.1 10.54 6.25 31.47 21.91 8.82 7.52 3,485 20.1 24.70 -<br />
Biotech HOLDRS BBH - 247.1 4.75 6.19 2.15 11.49 8.50 3.96 30,375 15.2 20.97 -<br />
0.60 147.0 1.99 6.19 25.58 20.02 3.97 1.99 479 17.7 28.88 0.35<br />
DSI 0.50 157.0 1.89 6.09 11.42 30.73 1.56 - 35,719 16.2 22.19 1.28<br />
0.38 142.9 1.72 5.73 26.97 48.71 11.55 - 689 13.8 30.87 1.12<br />
0.48 450.0 -0.61 5.71 11.98 62.42 3.86 7.43 43,756 16.4 25.44 0.48<br />
XLG 0.20 401.9 0.12 5.66 9.32 20.30 -0.46 2.33 144,813 14.4 19.67 1.84<br />
VGT 0.24 1,912.6 -0.78 5.64 12.78 61.89 4.60 7.36 41,260 16.7 25.25 0.56<br />
IWC 0.71 526.0 2.03 5.59 29.55 23.72 3.48 0.28 332 15.3 29.12 0.78<br />
VAW 0.24 719.2 2.28 5.48 24.46 51.44 -0.56 8.35 12,404 20.4 31.03 2.07<br />
IJS 0.25 1,853.2 1.46 5.48 24.70 22.36 4.43 3.21 1,024 18.1 28.44 1.14<br />
0.20 7,875.4 -0.06 5.38 11.41 51.25 2.99 6.60 74,838 15.4 23.10 1.26<br />
0.25 379.4 0.32 5.24 12.57 43.94 0.33 3.84 60,641 19.1 22.58 0.72<br />
0.25 134.4 1.47 5.19 24.62 36.93 5.97 4.78 1,025 18.1 29.03 1.69<br />
0.70 121.8 -1.35 4.86 19.25 33.55 3.93 - 7,065 11.5 30.90 1.21<br />
PowerShares Water Resources PHO 0.64 1,219.2 1.07 4.79 13.27 18.01 -3.76 3.62 2,400 19.3 28.98 0.51<br />
0.47 1,054.9 2.18 4.61 31.02 64.37 -0.18 9.39 14,735 14.6 34.75 1.15<br />
0.35 1,102.0 0.30 4.50 34.15 88.12 -5.46 - 3,455 22.2 44.77 0.57<br />
0.47 1,520.4 -1.56 4.45 12.42 63.79 4.40 7.39 57,836 15.8 25.09 0.42<br />
Retail HOLDRS RTH - 159.8 4.24 4.45 15.55 26.78 6.21 4.35 45,856 16.7 21.14 -<br />
0.48 274.2 -7.25 4.12 24.30 60.57 2.74 2.31 8,244 21.2 33.89 0.08<br />
XLB 0.20 2,648.7 1.05 3.81 20.56 48.11 -1.01 7.05 20,593 15.6 29.75 3.09<br />
0.38 249.3 1.57 3.71 27.05 22.15 5.39 - 877 17.2 30.82 3.26<br />
0.85 184.8 -3.19 3.55 - - - - - - - 5.09<br />
0.50 223.1 -2.40 3.42 15.31 70.44 4.04 6.86 38,543 17.3 27.52 0.44<br />
0.60 209.3 2.52 3.29 20.92 3.64 -0.97 -4.87 4,803 15.9 31.30 3.93<br />
0.85 132.2 -3.76 2.89 - - - - - - - 3.75<br />
iShares Dow Jones U.S. Home Construction ITB 0.47 500.0 1.44 2.75 10.43 23.24 -6.73 -19.65 2,626 22.5 42.28 0.59<br />
0.85 2,665.1 -3.97 2.28 34.53 - - - - - - 4.99<br />
0.85 1,113.9 -2.06 2.25 - - - - 7,312 27.0 - -<br />
0.48 520.0 -3.80 1.27 12.20 16.86 -9.18 -9.15 25,262 13.3 33.99 1.07<br />
0.27 662.7 -4.04 1.07 14.83 14.32 -8.44 -8.49 22,132 14.3 34.13 1.31<br />
0.35 208.3 -4.53 1.04 26.08 27.92 -1.43 -1.79 12,901 12.5 39.05 1.63<br />
0.48 164.9 -1.99 0.77 16.49 11.31 -5.19 - 3,190 7.4 20.27 9.57<br />
0.20 7,361.2 -5.75 -0.44 11.91 17.50 -11.86 -11.38 43,838 12.4 36.93 1.02<br />
0.35 579.6 -2.75 -1.83 20.65 -21.93 -5.44 - 1,322 19.6 33.10 1.40<br />
0.48 236.5 -6.13 -2.13 7.71 16.11 -11.96 -12.34 40,036 12.8 36.28 0.47<br />
IAT 0.48 144.1 -4.11 -2.79 20.25 -10.92 -8.96 -10.87 9,468 14.8 33.86 1.18<br />
0.35 1,480.6 -5.68 -3.53 23.07 -1.82 -10.96 -11.97 24,367 12.4 41.31 0.59<br />
- 105.0 -7.27 -3.91 12.62 3.29 -8.83 -9.26 58,953 11.5 37.79 -<br />
PBW 0.70 479.7 -11.25 -8.08 -5.55 27.61 -24.79 -14.31 1,306 13.4 39.30 -<br />
SCHH 0.13 122.2 5.91 - - - - - 7,511 41.6 - -<br />
International Equity<br />
0.54 209.8 2.81 17.66 -18.61 32.89 -6.39 4.83 37,530 - 38.02 4.99<br />
iShares S&P Global Healthcare IXJ 0.48 562.4 11.71 15.78 1.87 17.54 5.80 4.59 55,113 16.95 19.23 1.91<br />
0.54 463.1 4.58 14.85 -2.38 27.12 -5.49 1.75 42,903 13.04 33.22 2.37<br />
0.61 299.6 12.07 14.41 - - - - 6,883 14.81 - 0.95<br />
0.57 509.7 10.80 14.17 - - - - 1,543 22.15 - -<br />
0.55 108.1 16.67 14.12 - - - - 1,828 18.10 - -<br />
0.54 144.9 0.70 13.80 -14.20 21.97 -12.88 -5.20 29,072 12.32 36.79 1.71<br />
0.53 3,808.6 4.42 13.41 8.31 20.31 -4.04 5.80 47,041 13.83 34.51 1.06<br />
0.29 180.1 1.92 13.31 -7.75 25.23 -7.43 1.25 64,022 11.70 34.51 3.07<br />
0.53 585.0 10.35 13.08 14.48 22.05 4.88 7.38 63,415 14.77 24.90 1.15<br />
0.54 930.2 3.19 12.96 -3.00 26.41 -7.87 1.24 38,644 13.11 34.44 2.33<br />
DTH 0.58 140.7 3.68 11.85 -0.99 33.11 -4.82 - 40,749 12.01 30.23 3.95<br />
0.53 670.4 9.04 11.62 36.11 55.00 6.35 9.74 21,913 13.18 36.25 1.59<br />
0.6 1,448.3 3.71 11.61 3.74 28.90 -4.26 2.24 48,180 12.04 29.89 2.25<br />
0.14 3,656.1 4.15 11.37 6.05 31.33 -3.89 2.73 41,955 13.26 30.16 4.24<br />
DOO 0.58 160.4 5.20 11.27 5.70 33.13 -3.83 - 29,564 12.34 30.98 3.86<br />
DWX 0.45 532.1 7.06 11.13 7.87 62.12 0.10 - 9,930 10.14 35.72 4.19<br />
IXC 0.48 1,400.2 -1.89 10.60 11.79 24.71 -3.51 6.57 81,188 13.38 25.92 1.66<br />
IDV 0.5 544.0 4.07 10.51 11.84 60.56 0.14 - 17,608 12.20 33.56 3.63<br />
0.48 367.3 10.20 10.45 13.16 21.72 6.58 - 57,499 14.24 17.37 2.11<br />
Data as of 05/31/2011. Source: Morningstar. Exp Ratio is annual expense ratio. <strong>Asset</strong>s are net assets in $<strong>US</strong> millions. 3-Mo is 3-month <strong>to</strong>tal return. YTD is year-<strong>to</strong>-date. 3- <strong>and</strong> 5-year<br />
returns are annualized. Mkt Cap is geometric average market capitalization. P/E is price-<strong>to</strong>-earnings ratio. Std Dev is 3-year st<strong>and</strong>ard deviation. Yield is 12-month. Includes all<br />
U.S.-listed <strong>ETFs</strong> <strong>and</strong> ETNs with assets over $100 million.<br />
Yield<br />
ETFR • July 2011 19


