Flexoelectric rotation of polarization in ferroelectric thin films - Nature
Flexoelectric rotation of polarization in ferroelectric thin films - Nature
Flexoelectric rotation of polarization in ferroelectric thin films - Nature

Create successful ePaper yourself
Turn your PDF publications into a flip-book with our unique Google optimized e-Paper software.
NATURE MATERIALS DOI: 10.1038/NMAT3141<br />
ARTICLES<br />
a b c<br />
a doma<strong>in</strong><br />
c doma<strong>in</strong><br />
PbTiO 3<br />
c doma<strong>in</strong><br />
a doma<strong>in</strong><br />
0.6°<br />
0.9°<br />
0.7°<br />
0.7°<br />
0.5°<br />
0.15°<br />
0.4° 0.8°<br />
1°<br />
0.95°<br />
0.3°<br />
0.6°<br />
0.08<br />
0.09<br />
0.09<br />
0.07<br />
0.06<br />
0.055<br />
0.7<br />
0.065<br />
0.045<br />
0.035<br />
0.065<br />
¬0.015<br />
SrRuO 3<br />
20 nm DyScO 3<br />
0.0° (ref.) 20 nm 0.0 (ref.) 20 nm<br />
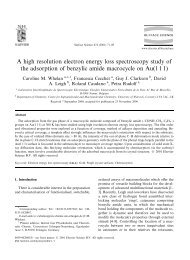
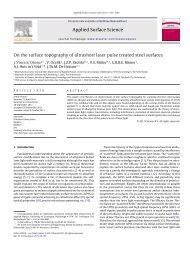
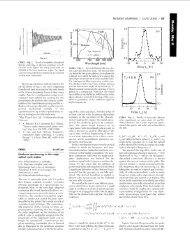
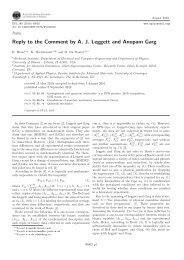
Figure 3 | Direct imag<strong>in</strong>g <strong>of</strong> stra<strong>in</strong> gradients. HAADF-STEM and GPA <strong>of</strong> the PbTiO 3 th<strong>in</strong> film grown on a SrRuO 3 buffer layer deposited on a DyScO 3<br />
substrate and studied <strong>in</strong> cross-section. a, HAADF image, show<strong>in</strong>g the structure. b, The map <strong>of</strong> lattice <strong>rotation</strong>s shows that the upper layers are more<br />
relaxed, and therefore more <strong>in</strong>cl<strong>in</strong>ed, than those close to the <strong>in</strong>terface. c, The out-<strong>of</strong>-plane stra<strong>in</strong> ε zz (relative to the DyScO 3 substrate, c = 3.95 Å) shows a<br />
higher tetragonality <strong>in</strong> the right-hand side <strong>of</strong> the c-doma<strong>in</strong> than <strong>in</strong> the left-hand side (obtuse). The difference arises from the local stress concentrations<br />
required to ‘flatten’ the <strong>in</strong>terface <strong>of</strong> the ferroelastic film onto the substrate, as shown <strong>in</strong> Fig. 5.<br />
and tw<strong>in</strong>n<strong>in</strong>g angle, <strong>in</strong> agreement with equation (1). This can also<br />
be observed <strong>in</strong> the out-<strong>of</strong>-plane diffraction maps around the 00L<br />
reflections (Fig. 2c).<br />
Further <strong>in</strong>sight can be ga<strong>in</strong>ed by probe-corrected high-angle<br />
annular dark-field scann<strong>in</strong>g transmission electron microscopy<br />
(HAADF-STEM) imag<strong>in</strong>g 39,40 , shown <strong>in</strong> Fig. 3. Quantitative<br />
analysis <strong>of</strong> the high-resolution HAADF-STEM images us<strong>in</strong>g<br />
geometric phase analysis (GPA; refs 41,42) and us<strong>in</strong>g the DyScO 3<br />
substrate as reference shows that there is a vertical gradient <strong>of</strong><br />
<strong>in</strong>cl<strong>in</strong>ations between the flatter bottom <strong>in</strong>terface and the more<br />
rumpled free surface, reflect<strong>in</strong>g the grow<strong>in</strong>g distance to the<br />
<strong>in</strong>terface, which is the source <strong>of</strong> stress. More unexpectedly, however,<br />
the <strong>films</strong> also show horizontal stra<strong>in</strong> gradients. The c doma<strong>in</strong>s,<br />
for example, reveal an <strong>in</strong>creased out-<strong>of</strong>-plane elongation <strong>in</strong> the<br />
acute wall–<strong>in</strong>terface corners, and a reduced tetragonality <strong>in</strong> the<br />
obtuse ones.<br />
This dist<strong>in</strong>ctive pattern can be understood by consideration <strong>of</strong><br />
the deformations that are required to attach a film with ferroelastic<br />
doma<strong>in</strong>s onto the flat surface <strong>of</strong> the substrate, as depicted <strong>in</strong> Fig. 4a.<br />
A useful analogy is to imag<strong>in</strong>e the forces needed to flatten an<br />
open book onto a photocopier. The concentration <strong>of</strong> stress at the<br />
corners <strong>of</strong> the doma<strong>in</strong>s leads to locally enhanced deformations,<br />
<strong>in</strong>clud<strong>in</strong>g bend<strong>in</strong>g <strong>of</strong> the doma<strong>in</strong> walls to preserve coherence, as<br />
observed. Yet another way to understand the stra<strong>in</strong> difference is to<br />
consider that, whereas the bottom <strong>in</strong>terface must be flat, the top<br />
<strong>in</strong>terface is freer to relax towards its natural ‘rumpled’ state with<br />
<strong>in</strong>cl<strong>in</strong>ed planes: the net result is that, for each doma<strong>in</strong>, one side is<br />
thicker than the other (see Fig. 4b), and thus there is a horizontal<br />
gradient <strong>of</strong> vertical expansion. This transverse gradient will generate<br />
a horizontal flexoelectricity, caus<strong>in</strong>g the vertical <strong>polarization</strong> to<br />
rotate towards the thicker side (Fig. 4b.)<br />
We can estimate the horizontal flexoelectricity and its effect<br />
on the spontaneous <strong>polarization</strong>. The transverse flexoelectric<br />
coefficient <strong>of</strong> lead zirconate–titanate (PZT) is f 13 ∼ 1 µC m −1<br />
(ref. 43). <strong>Flexoelectric</strong>ity is proportional to permittivity 7,10,12,17 ,<br />
which is ∼5 times smaller for pure PbTiO 3 than for PZT 44 , so the<br />
transverse flexoelectric coefficient <strong>of</strong> PbTiO 3 should be less than<br />
f 13 ≈ 200 nC m −1 . The out-<strong>of</strong>-plane stra<strong>in</strong> difference between the<br />
acute and obtuse corners <strong>of</strong> the c doma<strong>in</strong>s is ε 3 ≈ 0.03 (Fig. 3c),<br />
and the relaxation length is approximately the c-doma<strong>in</strong> width (w ≈<br />
40 nm). Therefore, the average horizontal flexoelectricity across the<br />
doma<strong>in</strong> should be around P x(flexo)<br />
∼ =f13 (ε 3 /w)≈15 µC cm −2 .<br />
This flexoelectric <strong>polarization</strong> is very large; it is <strong>in</strong> fact comparable<br />
to the spontaneous <strong>polarization</strong> <strong>of</strong> archetypal <strong>ferroelectric</strong>s,<br />
and will therefore have a strong effect on the <strong>ferroelectric</strong>ity. In<br />
b<br />
a<br />
a<br />
P ferro<br />
c<br />
Substrate<br />
P flexo<br />
Substrate<br />
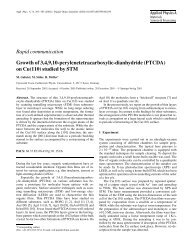
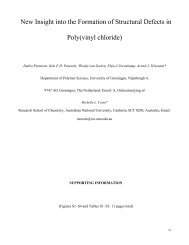
Figure 4 | Sketch <strong>of</strong> stresses, stra<strong>in</strong> gradients and polar vectors <strong>in</strong> the<br />
tw<strong>in</strong>ned film. a, Schematic representation <strong>of</strong> the doma<strong>in</strong> structure <strong>in</strong> a film<br />
with a–c doma<strong>in</strong>s. The black arrows represent the stresses that must be<br />
applied to the tw<strong>in</strong>ned film to flatten it onto the substrate. b, The<br />
flexoelectric <strong>polarization</strong> (grey) <strong>in</strong>duces a <strong>rotation</strong> <strong>of</strong> the <strong>ferroelectric</strong><br />
<strong>polarization</strong> <strong>of</strong> the c doma<strong>in</strong> (blue).<br />
particular, the addition <strong>of</strong> the horizontal flexoelectricity to the<br />
vertical <strong>ferroelectric</strong>ity <strong>of</strong> the c doma<strong>in</strong>s will result <strong>in</strong> a rotated<br />
<strong>polarization</strong> (see Fig. 4b), with an angle, β, given by tan β =<br />
P flexo /P ferro . Us<strong>in</strong>g P flexo ∼ 15 µC cm −2 and P ferro = 40–60 µC cm −2 ,<br />
an average polar <strong>rotation</strong> <strong>of</strong> β ∼ 10 ◦ –15 ◦ is expected with respect to<br />
the normal direction.<br />
To test this prediction, accurate measurements <strong>of</strong> lattice<br />
distortions were carried out by <strong>in</strong>creas<strong>in</strong>g the STEM resolution<br />
and carry<strong>in</strong>g out dedicated model-based peak f<strong>in</strong>d<strong>in</strong>g to determ<strong>in</strong>e<br />
atomic column positions. Ow<strong>in</strong>g to the Z-dependent contrast,<br />
Pb and TiO columns can be easily dist<strong>in</strong>guished, whereas weakly<br />
scatter<strong>in</strong>g O columns are not visible (see Fig. 5a). On the basis<br />
<strong>of</strong> the determ<strong>in</strong>ed Pb and TiO column positions, both the stra<strong>in</strong><br />
tensor and the Pb–TiO distance vector (proportional to the<br />
electric <strong>polarization</strong> through the Born effective charge tensor 45 )<br />
are mapped unit-cell-wise (see Fig. 5b). Polarization mapp<strong>in</strong>g can<br />
also be done by other electron microscopy techniques 46 , although<br />
HAADF has the advantage that the samples need not be so th<strong>in</strong><br />
and the less aggressive sample preparation helps preserve the<br />
native doma<strong>in</strong> structure 40 .<br />
In agreement with the GPA shown <strong>in</strong> Fig. 3, we observe a<br />
large difference <strong>in</strong> out-<strong>of</strong>-plane stra<strong>in</strong>, tensile <strong>in</strong> the acute corners<br />
and compressive <strong>in</strong> the obtuse ones, lead<strong>in</strong>g to a horizontal<br />
a<br />
NATURE MATERIALS | VOL 10 | DECEMBER 2011 | www.nature.com/naturematerials 965<br />
© 2011 Macmillan Publishers Limited. All rights reserved