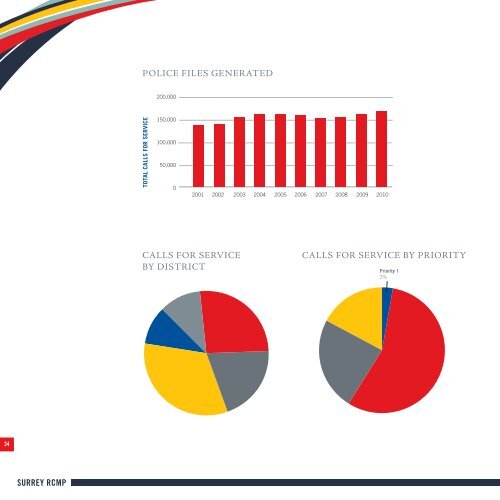
POLICE FILES GENERATED 200,000 TOTAL CALLS FOR SERVICE 150,000 100,000 50,000 0 2001 2002 2003 2004 2005 2006 2007 2008 2009 <strong>2010</strong> CALLS FOR SERVICE BY DISTRICT CALLS FOR SERVICE BY PRIORITY Priority 1 3% District 4 10% District 5 11% District 1 26% Priority 4 17% District 3 33% District 2 20% Priority 3 24% Priority 2 56% 34
SELECT CRIMINAL CODE OFFENCES VIOLENT CRIMES <strong>2010</strong> 2009 % CHANGE Homicide 13 20 -35.0% Attempted murder 12 21 -42.9% Sexual Assault 290 259 12.0% Sexual violations against children 61 37 64.9% Total Assaults 4,402 4,557 -3.4% Assault, level 3, aggravated 46 44 4.5% Assault, level 2, weapon or bodily harm 1,179 1,126 4.7% Assault, level 1 2,926 3,244 -9.8% Assault peace <strong>of</strong>ficer (total) 223 132 68.9% Total other assaults 28 11 154.5% Total firearms (use <strong>of</strong>, discharge, pointing) 58 43 34.9% Robbery 900 852 5.6% Forcible confinement or kidnapping 39 52 -25.0% Abduction 10 22 -54.5% Criminal harassment 132 111 18.9% Uttering threats 1,693 1,826 -7.3% Threatening or harassing phone calls 611 599 2.0% TOTAL 8,293 8,467 -2.1% OTHER CC OFFENCES <strong>2010</strong> 2009 % CHANGE Counterfeiting 9 18 -50.0% Weapons violations (Total) 341 362 -5.8% Child pornography 15 19 -21.1% Total prostitution 177 219 -19.2% Disturb the peace 5,911 6,176 -4.3% Administration <strong>of</strong> justice violations 1,195 1,142 4.6% Total other violations 846 803 5.4% Indecent acts 139 136 2.2% Obstruct public or peace <strong>of</strong>ficer 168 185 -9.2% Trespass at night 129 93 38.7% Utter threats to property or animal 151 140 7.9% TOTAL 8,494 8,739 -2.8% TOTAL CRIMINAL CODE 42,662 44,323 -3.7% Source: Uniform Crime <strong>Report</strong>ing Survey <strong>2010</strong>, Canadian Centre for Justice Statistics, Statistics Canada. Crime figures include the most serious <strong>of</strong>fence only. Traffic Offences are not included in the total Criminal Code counts. PROPERTY CRIMES <strong>2010</strong> 2009 % CHANGE Breaking and entering 3,658 3,945 -7.3% Possess stolen property 311 369 -15.7% Theft <strong>of</strong> motor vehicle 3,067 3,796 -19.2% Total theft over $5,000 (non-motor vehicle) 246 243 1.2% Theft over $5,000 158 173 -8.7% Theft over $5,000 from a motor vehicle 83 66 25.8% Shoplifting over $5,000 5 4 25.0% Total theft under $5,000 (non-motor vehicle) 11,969 11,555 3.6% Theft $5,000 or under 3,612 3,271 10.4% Theft $5,000 or under from a motor vehicle 6,176 6,310 -2.1% Shoplifting $5,000 or under 2,181 1,974 10.5% Fraud 1,324 1,653 -19.9% Identity Theft/Fraud 222 NA NA Mischief 4,844 5,300 -8.6% Arson 234 256 -8.6% TOTAL 25,875 27,117 -4.6% 35 <strong>2010</strong> REPORT TO THE COMMUNITY