Discover 11.0 Release Notes - MapInfo
Discover 11.0 Release Notes - MapInfo
Discover 11.0 Release Notes - MapInfo

You also want an ePaper? Increase the reach of your titles
YUMPU automatically turns print PDFs into web optimized ePapers that Google loves.
elease notes<br />
discover version <strong>11.0</strong><br />
release notes<br />
What’s New in <strong>Discover</strong> 11?<br />
• Support for <strong>MapInfo</strong> Professional 10.<br />
• Updated support for version 4.2.0<br />
of the acQuire database model.<br />
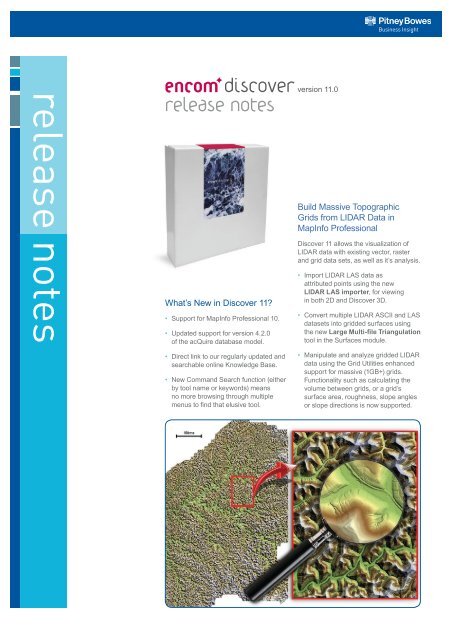
Build Massive Topographic<br />
Grids from LIDAR Data in<br />
<strong>MapInfo</strong> Professional<br />
<strong>Discover</strong> 11 allows the visualization of<br />
LIDAR data with existing vector, raster<br />
and grid data sets, as well as it’s analysis.<br />
• Import LIDAR LAS data as<br />
attributed points using the new<br />
LIDAR LAS importer, for viewing<br />
in both 2D and <strong>Discover</strong> 3D.<br />
• Convert multiple LIDAR ASCII and LAS<br />
datasets into gridded surfaces using<br />
the new Large Multi-file Triangulation<br />
tool in the Surfaces module.<br />
• Direct link to our regularly updated and<br />
searchable online Knowledge Base.<br />
• New Command Search function (either<br />
by tool name or keywords) means<br />
no more browsing through multiple<br />
menus to find that elusive tool.<br />
• Manipulate and analyze gridded LIDAR<br />
data using the Grid Utilities enhanced<br />
support for massive (1GB+) grids.<br />
Functionality such as calculating the<br />
volume between grids, or a grid’s<br />
surface area, roughness, slope angles<br />
or slope directions is now supported.
Continued Support for<br />
Multi-Gigabyte Grids<br />
Enhanced Grid Utilities<br />
Building on the very large grid<br />
(e.g. continental-scale) import and<br />
visualization support implemented<br />
previously, <strong>Discover</strong> 11 can now<br />
manipulate massive grids using<br />
its powerful Grid Utilities, such as<br />
Reproject, Clip, Overlay and Merge.<br />
New Large Multi-file triangulation tool<br />
<strong>Discover</strong> can now build very large<br />
grids from multiple input files and/or<br />
massive data sets such as LIDAR data.<br />
• Interpolate multiple input files<br />
into a single gridded surface<br />
using triangulation.<br />
• Interpolate massive data sets such<br />
as LIDAR ASCII and LAS data,<br />
TAB point and contour files into<br />
gridded files using triangulation.<br />
New large grid formats supported<br />
• USGS DEM grids<br />
• USGS grids<br />
• Geopak grids<br />
• GeoTIFFs with embedded elevation<br />
New Hydrology Toolbox<br />
<strong>Discover</strong> 11’s new hydrology toolbox can<br />
automatically extract drainage features<br />
from gridded digital elevation surfaces.<br />
This will greatly assist disciplines<br />
such as environmental monitoring,<br />
water management, exploration and<br />
engineering. Functionality includes:<br />
• DEM pit filling to remove unnatural<br />
pits, permitting continuous flow<br />
along drainage networks.<br />
• Flow direction, slope, accumulation<br />
and threshold calculations.<br />
• Stream junction extraction as points.<br />
• Stream network extraction as polylines,<br />
with hierarchical stream order ranking.<br />
• Watershed/catchment.<br />
delineation as polygons.<br />
GraphMap<br />
New Data clock graph type<br />
The new Data Clock graph type is<br />
ideal for Time / Frequency or Temporal<br />
analysis, such as pollution monitoring in<br />
streams, water or salinity-level monitoring<br />
in bores, sewerage/water discharge<br />
rates and wind direction related data.<br />
Any of the following date or time intervals<br />
can be extracted from a Date/Time<br />
field and displayed as either exterior<br />
wedges or interior circles of the clock:<br />
• Year<br />
• Month of Year<br />
• Day of year<br />
• Day of Month<br />
• Day of Week<br />
• Hour of Day<br />
• AM/PM<br />
• Minute of Hour<br />
• Second of Minute<br />
• Unique<br />
Additional enhancements<br />
made to the GraphMap tool<br />
• A new visibility control, for<br />
filtering displayed points based<br />
on a grouping or filter field.<br />
• Data Preconditioning can now<br />
convert between data field types<br />
and includes a data preview.<br />
• Redesigned Graph Builder wizard<br />
for more interactive graph creation.<br />
• Ability to customize the graph<br />
bin colours in a Pie chart.<br />
• Improved setup of multiple<br />
table relationships.<br />
• Improved Date/Time<br />
support on graphs.
Drillholes<br />
New Polyline Section definition tool<br />
Drillhole cross sections can now<br />
be defined along a non-linear<br />
path, using a selected polyline<br />
(for vertical drillholes only).<br />
This functionality is ideal for the<br />
hydrological, geological and<br />
environmental engineering industries who<br />
often need to analyze data along non<br />
linear sections such as pipe lines, roads,<br />
tunnels and subsurface palaeochannels<br />
or aquifers.<br />
New Project Session management<br />
Project Sessions allow cross-section<br />
and plan layouts and all associated<br />
components (titleblock, legends,<br />
scale bars, map windows, etc.) to be<br />
easily saved and reopened, much like<br />
a <strong>MapInfo</strong> Professional workspace.<br />
However, drillhole project sessions also<br />
preserve the parent drillhole project,<br />
reopening all the required data and<br />
settings when the session is opened.<br />
This is a very powerful way of handling<br />
projects when saving multiple sections’<br />
layout windows for hardcopy output,<br />
or regularly opening a number of<br />
cross-section map windows.<br />
New Display Downhole Data tool<br />
A completely redesigned tool makes<br />
creating and finessing the downhole<br />
data displays on your sections interactive<br />
and painless. New features include:<br />
• An intuitive interface that provides clear<br />
visualization and easy modification<br />
of display settings, including the<br />
adjustment of the individual display<br />
type offsets with respect to each other.<br />
• Downhole display settings are<br />
now easily shared between users.<br />
These can be project specific, and<br />
are automatically stored with each<br />
section for hassle-free reuse.<br />
• The width of linegraphs and histograms<br />
can now be specified (rather than a<br />
scale) in millimetres, allowing precise<br />
sizing control to prevent overlaps.<br />
Other changes<br />
Additional interface and performance<br />
improvements have been made<br />
to the following tools:<br />
• Project Manager<br />
• Section Manager<br />
• Draw Section Grid<br />
• Add Section Layout<br />
New Tenement Module<br />
The <strong>Discover</strong> Tenement module<br />
has been completely redesigned to<br />
provide an interactive interface for<br />
creating new applications, searching<br />
through existing tenement data and for<br />
downloading regular tenement updates:<br />
• Download regularly-updated Australian<br />
mineral tenement data via a webbased<br />
subscription service.<br />
• Straightforward tenement<br />
querying by date, licence type<br />
and holder information.<br />
• New application interface with<br />
interactive state and datum selection.<br />
• Create polygonised block and<br />
sub-block reference grids.<br />
• Create new or modify existing<br />
applications by selecting sub-blocks<br />
manually or interactively, including subblock<br />
counter, limit and area checks.<br />
• Tenement application reports<br />
automatically created for entry into<br />
standard statutory application forms.<br />
New Import Support<br />
• DataSight database importer:<br />
Import data directly from the<br />
DataSight environmental data<br />
management platform.<br />
• ioGAS Importer.<br />
• LIDAR LAS importer: Import LIDAR<br />
data as points. LAS data can now<br />
also be gridded using the new Large<br />
Multi-file Triangulation tool.
Raster Imagery Support<br />
Support added for largesraster<br />
image formats<br />
<strong>Discover</strong> can now automatically open and<br />
register the following large image formats:<br />
• ER Mapper’s ECW/ECWP.<br />
• JPEG2000/JP2K.<br />
New Create Registered Raster tool<br />
• Now capture a mapper window<br />
as an ECW image.<br />
Documentation<br />
• A complete rewrite of the user<br />
documentation provides more useful<br />
information that is much easier to find. i<br />
• The new task-oriented User Guide<br />
includes extensive “how-to” topics<br />
and direct cross-references to<br />
the more detailed information<br />
in the Reference Manual.<br />
Other Improvements<br />
Menu auto-start options in the<br />
Configuration dialog now automatically<br />
open menus into the current session.<br />
System Requirements<br />
Encom <strong>Discover</strong> 11 requires <strong>MapInfo</strong><br />
Professional 8.5 to 10, with Windows XP<br />
or Vista.<br />
Contact Pitney Bowes Business<br />
Insight<br />
Asia-Pacific/Australia<br />
Level 7, 1 Elizabeth Plaza<br />
North Sydney NSW 2060 Australia<br />
T + 61 2 9437 6255 F +61 2 9439 1773<br />
355 Newcastle Street<br />
Northbridge WA 6003 Australia<br />
T +61 8 9226 0101 F +61 8 9226 0102<br />
Americas<br />
26 Wellington Street East, Suite 500<br />
Toronto, Ontario M5E 1S2 Canada<br />
T +1 416 594 5200 F +1 416 594 5201<br />
Europe/United Kingdom<br />
Minton Place, Victoria Street, Windsor<br />
Berkshire SL4 1EG United Kingdom<br />
T +44 1753 848200 F +44 1753 621140<br />
discover@encom.com.au<br />
www.encom.com.au<br />
Windows XP ® and Windows Vista ® are registered trademarks of Microsoft<br />
Corporation. <strong>MapInfo</strong> Professional ® is a US registered trademark of<br />
Pitney Bowes Software Inc. <strong>Discover</strong> <strong>Release</strong> <strong>Notes</strong> Document <strong>11.0</strong>0