Americas and Oceania Group - International Plant Nutrition Institute
Americas and Oceania Group - International Plant Nutrition Institute
Americas and Oceania Group - International Plant Nutrition Institute
You also want an ePaper? Increase the reach of your titles
YUMPU automatically turns print PDFs into web optimized ePapers that Google loves.
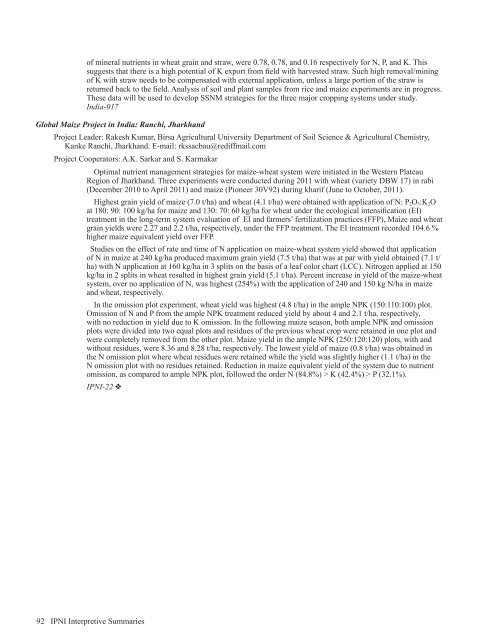
of mineral nutrients in wheat grain <strong>and</strong> straw, were 0.78, 0.78, <strong>and</strong> 0.16 respectively for N, P, <strong>and</strong> K. This<br />
suggests that there is a high potential of K export from field with harvested straw. Such high removal/mining<br />
of K with straw needs to be compensated with external application, unless a large portion of the straw is<br />
returned back to the field. Analysis of soil <strong>and</strong> plant samples from rice <strong>and</strong> maize experiments are in progress.<br />
These data will be used to develop SSNM strategies for the three major cropping systems under study.<br />
India-017<br />
Global Maize Project in India: Ranchi, Jharkh<strong>and</strong><br />
Project Leader: Rakesh Kumar, Birsa Agricultural University Department of Soil Science & Agricultural Chemistry,<br />
Kanke Ranchi, Jharkh<strong>and</strong>. E-mail: rkssacbau@rediffmail.com<br />
Project Cooperators: A.K. Sarkar <strong>and</strong> S. Karmakar<br />
Optimal nutrient management strategies for maize-wheat system were initiated in the Western Plateau<br />
Region of Jharkh<strong>and</strong>. Three experiments were conducted during 2011 with wheat (variety DBW 17) in rabi<br />
(December 2010 to April 2011) <strong>and</strong> maize (Pioneer 30V92) during kharif (June to October, 2011).<br />
Highest grain yield of maize (7.0 t/ha) <strong>and</strong> wheat (4.1 t/ha) were obtained with application of N: P 2 O 5 :K 2 O<br />
at 180: 90: 100 kg/ha for maize <strong>and</strong> 130: 70: 60 kg/ha for wheat under the ecological intensification (EI)<br />
treatment in the long-term system evaluation of EI <strong>and</strong> farmers’ fertilization practices (FFP), Maize <strong>and</strong> wheat<br />
grain yields were 2.27 <strong>and</strong> 2.2 t/ha, respectively, under the FFP treatment. The EI treatment recorded 104.6 %<br />
higher maize equivalent yield over FFP.<br />
Studies on the effect of rate <strong>and</strong> time of N application on maize-wheat system yield showed that application<br />
of N in maize at 240 kg/ha produced maximum grain yield (7.5 t/ha) that was at par with yield obtained (7.1 t/<br />
ha) with N application at 160 kg/ha in 3 splits on the basis of a leaf color chart (LCC). Nitrogen applied at 150<br />
kg/ha in 2 splits in wheat resulted in highest grain yield (5.1 t/ha). Percent increase in yield of the maize-wheat<br />
system, over no application of N, was highest (254%) with the application of 240 <strong>and</strong> 150 kg N/ha in maize<br />
<strong>and</strong> wheat, respectively.<br />
In the omission plot experiment, wheat yield was highest (4.8 t/ha) in the ample NPK (150:110:100) plot.<br />
Omission of N <strong>and</strong> P from the ample NPK treatment reduced yield by about 4 <strong>and</strong> 2.1 t/ha, respectively,<br />
with no reduction in yield due to K omission. In the following maize season, both ample NPK <strong>and</strong> omission<br />
plots were divided into two equal plots <strong>and</strong> residues of the previous wheat crop were retained in one plot <strong>and</strong><br />
were completely removed from the other plot. Maize yield in the ample NPK (250:120:120) plots, with <strong>and</strong><br />
without residues, were 8.36 <strong>and</strong> 8.28 t/ha, respectively. The lowest yield of maize (0.8 t/ha) was obtained in<br />
the N omission plot where wheat residues were retained while the yield was slightly higher (1.1 t/ha) in the<br />
N omission plot with no residues retained. Reduction in maize equivalent yield of the system due to nutrient<br />
omission, as compared to ample NPK plot, followed the order N (84.8%) > K (42.4%) > P (32.1%).<br />
IPNI-22 v<br />
92 IPNI Interpretive Summaries


