three phase lcd multifunction meters
three phase lcd multifunction meters
three phase lcd multifunction meters

You also want an ePaper? Increase the reach of your titles
YUMPU automatically turns print PDFs into web optimized ePapers that Google loves.
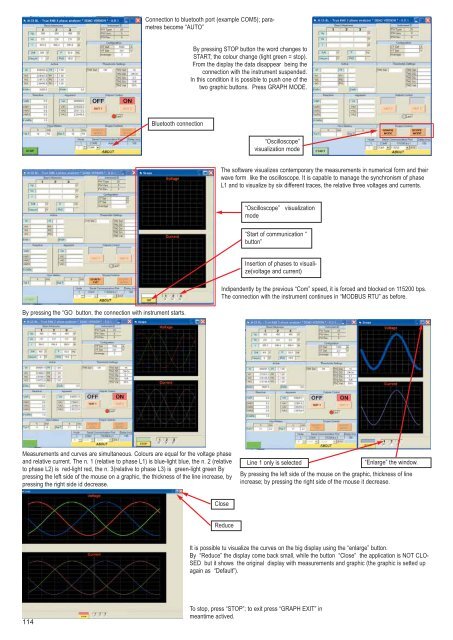
Connection to bluetooth port (example COM5); parametres<br />
become “AUTO”<br />
By pressing STOP button the word changes to<br />
START; the colour change (light green = stop).<br />
From the display the data disappear being the<br />
connection with the instrument suspended.<br />
In this condition it is possible to push one of the<br />
two graphic buttons. Press GRAPH MODE.<br />
Bluetooth connection<br />
“Oscilloscope”<br />
visualization mode<br />
The software visualizes contemporary the measurements in numerical form and their<br />
wave form like the oscilloscope. It is capable to manage the synchronism of <strong>phase</strong><br />
L1 and to visualize by six different traces, the relative <strong>three</strong> voltages and currents.<br />
“Oscilloscope” visualization<br />
mode<br />
“Start of communication “<br />
button”<br />
Insertion of <strong>phase</strong>s to visualize(voltage<br />
and current)<br />
By pressing the “GO button, the connection with instrument starts.<br />
Indipendently by the previous “Com” speed, it is forced and blocked on 115200 bps.<br />
The connection with the instrument continues in “MODBUS RTU” as before.<br />
Measurements and curves are simultaneous. Colours are equal for the voltage <strong>phase</strong><br />
and relative current. The n. 1 (relative to <strong>phase</strong> L1) is blue-light blue, the n. 2 (relative<br />
to <strong>phase</strong> L2) is red-light red, the n. 3(relative to <strong>phase</strong> L3) is green-light green By<br />
pressing the left side of the mouse on a graphic, the thickness of the line increase, by<br />
pressing the right side id decrease.<br />
Line 1 only is selected<br />
“Enlarge” the window.<br />
By pressing the left side of the mouse on the graphic, thickness of line<br />
increase; by pressing the right side of the mouse it decrease.<br />
Close<br />
Reduce<br />
It is possible tu visualize the curves on the big display using the “enlarge” button.<br />
By “Reduce” the display come back small, while the button “Close” the application is NOT CLO-<br />
SED but it shows the original display with measurements and graphic (the graphic is setted up<br />
again as “Default”).<br />
114<br />
To stop, press “STOP”; to exit press “GRAPH EXIT” in<br />
meantime actived.