History of the Ammunition Industrial Base - JMC - U.S. Army
History of the Ammunition Industrial Base - JMC - U.S. Army
History of the Ammunition Industrial Base - JMC - U.S. Army

You also want an ePaper? Increase the reach of your titles
YUMPU automatically turns print PDFs into web optimized ePapers that Google loves.
(8 active and 16 inactive plants) was producing at a rate <strong>of</strong> 7% percent <strong>of</strong> <strong>the</strong> maximum rate<br />
required to match <strong>the</strong> envisioned consumption rate <strong>of</strong> basic <strong>Army</strong> forces. At <strong>the</strong> onset <strong>of</strong><br />
Vietnam, <strong>the</strong> <strong>Army</strong>‟s in-house munitions production base consisted <strong>of</strong> 26 GOCO production<br />
facilities managed by <strong>the</strong> U.S. <strong>Army</strong> Munitions Command (MUCOM), 24 <strong>of</strong> which produced<br />
conventional munitions. According to RJ Hammond <strong>the</strong> industrial base operated near capacity<br />
throughout <strong>the</strong> Vietnam Conflict. 116 MUCOM annual histories from this time also illustrated<br />
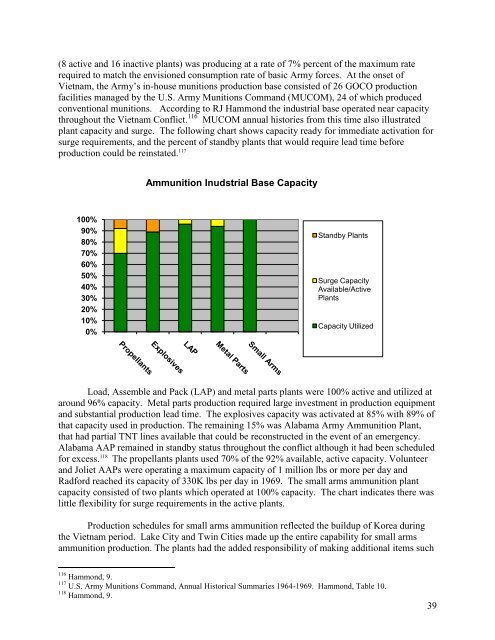
plant capacity and surge. The following chart shows capacity ready for immediate activation for<br />
surge requirements, and <strong>the</strong> percent <strong>of</strong> standby plants that would require lead time before<br />
production could be reinstated. 117<br />
<strong>Ammunition</strong> Inudstrial <strong>Base</strong> Capacity<br />
100%<br />
90%<br />
80%<br />
70%<br />
60%<br />
50%<br />
40%<br />
30%<br />
20%<br />
10%<br />
0%<br />
Standby Plants<br />
Surge Capacity<br />
Available/Active<br />
Plants<br />
Capacity Utilized<br />
Load, Assemble and Pack (LAP) and metal parts plants were 100% active and utilized at<br />
around 96% capacity. Metal parts production required large investment in production equipment<br />
and substantial production lead time. The explosives capacity was activated at 85% with 89% <strong>of</strong><br />
that capacity used in production. The remaining 15% was Alabama <strong>Army</strong> <strong>Ammunition</strong> Plant,<br />
that had partial TNT lines available that could be reconstructed in <strong>the</strong> event <strong>of</strong> an emergency.<br />
Alabama AAP remained in standby status throughout <strong>the</strong> conflict although it had been scheduled<br />
for excess. 118 The propellants plants used 70% <strong>of</strong> <strong>the</strong> 92% available, active capacity. Volunteer<br />
and Joliet AAPs were operating a maximum capacity <strong>of</strong> 1 million lbs or more per day and<br />
Radford reached its capacity <strong>of</strong> 330K lbs per day in 1969. The small arms ammunition plant<br />
capacity consisted <strong>of</strong> two plants which operated at 100% capacity. The chart indicates <strong>the</strong>re was<br />
little flexibility for surge requirements in <strong>the</strong> active plants.<br />
Production schedules for small arms ammunition reflected <strong>the</strong> buildup <strong>of</strong> Korea during<br />
<strong>the</strong> Vietnam period. Lake City and Twin Cities made up <strong>the</strong> entire capability for small arms<br />
ammunition production. The plants had <strong>the</strong> added responsibility <strong>of</strong> making additional items such<br />
116 Hammond, 9.<br />
117 U.S. <strong>Army</strong> Munitions Command, Annual Historical Summaries 1964-1969. Hammond, Table 10.<br />
118 Hammond, 9.<br />
39