- Page 1 and 2: Release 8 Scripting Guide Second Ed
- Page 3 and 4: Table of Contents JMP Scripting Gui
- Page 5 and 6: iii 4 Programming Functions Script
- Page 7 and 8: v Construct a custom platform . . .
- Page 9 and 10: vii Definitions . . . . . . . . . .
- Page 11: ix B Data Tables, Rows, and Columns
- Page 14 and 15: xii Linda Blazek, Michael Friendly,
- Page 17 and 18: Chapter 1 Introducing JSL Tutorials
- Page 19 and 20: Chapter 1 Introducing JSL 3 Hello,
- Page 21 and 22: Chapter 1 Introducing JSL 5 Hello,
- Page 23 and 24: Chapter 1 Introducing JSL 7 Saving
- Page 25 and 26: Chapter 1 Introducing JSL 9 Saving
- Page 27 and 28: Chapter 1 Introducing JSL 11 Sample
- Page 29 and 30: Chapter 1 Introducing JSL 13 Sample
- Page 31 and 32: Chapter 1 Introducing JSL 15 Sample
- Page 33 and 34: Chapter 1 Introducing JSL 17 Sample
- Page 35 and 36: Chapter 1 Introducing JSL 19 Sample
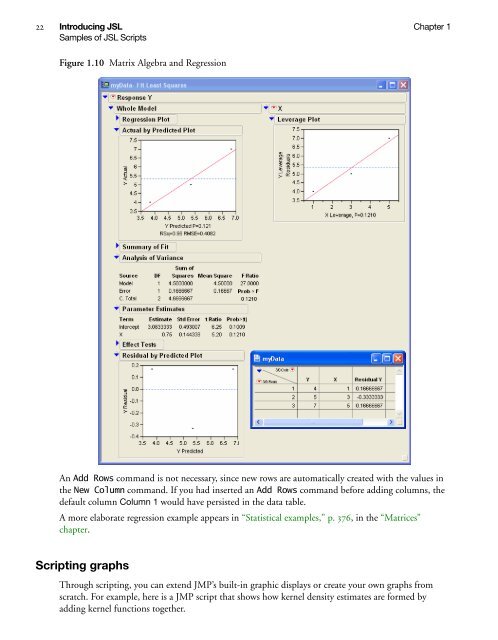
- Page 37: Chapter 1 Introducing JSL 21 Sample
- Page 41 and 42: Chapter 1 Introducing JSL 25 Sample
- Page 43: Chapter 1 Introducing JSL 27 Sample
- Page 46 and 47: Contents First JSL Script. . . . .
- Page 48 and 49: 32 JSL Building Blocks Chapter 2 Th
- Page 50 and 51: 34 JSL Building Blocks Chapter 2 Th
- Page 52 and 53: 36 JSL Building Blocks Chapter 2 Th
- Page 54 and 55: 38 JSL Building Blocks Chapter 2 Th
- Page 56 and 57: 40 JSL Building Blocks Chapter 2 Co
- Page 58 and 59: 42 JSL Building Blocks Chapter 2 Na
- Page 60 and 61: 44 JSL Building Blocks Chapter 2 Na
- Page 62 and 63: 46 JSL Building Blocks Chapter 2 Na
- Page 64 and 65: 48 JSL Building Blocks Chapter 2 Us
- Page 66 and 67: 50 JSL Building Blocks Chapter 2 Us
- Page 68 and 69: 52 JSL Building Blocks Chapter 2 Us
- Page 70 and 71: 54 JSL Building Blocks Chapter 2 He
- Page 72 and 73: 56 JSL Building Blocks Chapter 2 He
- Page 75 and 76: Chapter 3 JSL Operators The basic f
- Page 77 and 78: Chapter 3 JSL Operators 61 Numeric
- Page 79 and 80: Chapter 3 JSL Operators 63 Numeric
- Page 81 and 82: Chapter 3 JSL Operators 65 Numeric
- Page 83 and 84: Chapter 3 JSL Operators 67 Characte
- Page 85 and 86: Chapter 3 JSL Operators 69 Characte
- Page 87 and 88: Chapter 3 JSL Operators 71 Characte
- Page 89 and 90:
Chapter 3 JSL Operators 73 Characte
- Page 91 and 92:
Chapter 3 JSL Operators 75 Comparis
- Page 93 and 94:
Chapter 3 JSL Operators 77 Comparis
- Page 95 and 96:
Chapter 3 JSL Operators 79 Date/Tim
- Page 97 and 98:
Chapter 3 JSL Operators 81 Date/Tim
- Page 99 and 100:
Chapter 3 JSL Operators 83 Date/Tim
- Page 101 and 102:
Chapter 3 JSL Operators 85 Currency
- Page 103 and 104:
Chapter 3 JSL Operators 87 Function
- Page 105:
Chapter 3 JSL Operators 89 Function
- Page 108 and 109:
Contents Programming Example. . . .
- Page 110 and 111:
94 Programming Functions Chapter 4
- Page 112 and 113:
96 Programming Functions Chapter 4
- Page 114 and 115:
98 Programming Functions Chapter 4
- Page 116 and 117:
100 Programming Functions Chapter 4
- Page 118 and 119:
102 Programming Functions Chapter 4
- Page 120 and 121:
104 Programming Functions Chapter 4
- Page 122 and 123:
106 Programming Functions Chapter 4
- Page 124 and 125:
108 Programming Functions Chapter 4
- Page 126 and 127:
110 Programming Functions Chapter 4
- Page 129 and 130:
Chapter 5 Data Tables Create, open,
- Page 131 and 132:
Chapter 5 Data Tables 115 Data tabl
- Page 133 and 134:
Chapter 5 Data Tables 117 Data tabl
- Page 135 and 136:
Chapter 5 Data Tables 119 Data tabl
- Page 137 and 138:
Chapter 5 Data Tables 121 Data tabl
- Page 139 and 140:
Chapter 5 Data Tables 123 Messages
- Page 141 and 142:
Chapter 5 Data Tables 125 Messages
- Page 143 and 144:
Chapter 5 Data Tables 127 Messages
- Page 145 and 146:
Chapter 5 Data Tables 129 Messages
- Page 147 and 148:
Chapter 5 Data Tables 131 Messages
- Page 149 and 150:
Chapter 5 Data Tables 133 Messages
- Page 151 and 152:
Chapter 5 Data Tables 135 Messages
- Page 153 and 154:
Chapter 5 Data Tables 137 Messages
- Page 155 and 156:
Chapter 5 Data Tables 139 Messages
- Page 157 and 158:
Chapter 5 Data Tables 141 Messages
- Page 159 and 160:
Chapter 5 Data Tables 143 Messages
- Page 161 and 162:
Chapter 5 Data Tables 145 Manipulat
- Page 163 and 164:
Chapter 5 Data Tables 147 Manipulat
- Page 165 and 166:
Chapter 5 Data Tables 149 Manipulat
- Page 167 and 168:
Chapter 5 Data Tables 151 Manipulat
- Page 169 and 170:
Chapter 5 Data Tables 153 Manipulat
- Page 171 and 172:
Chapter 5 Data Tables 155 Row State
- Page 173 and 174:
Chapter 5 Data Tables 157 Row State
- Page 175 and 176:
Chapter 5 Data Tables 159 Row State
- Page 177 and 178:
Chapter 5 Data Tables 161 Row State
- Page 179 and 180:
Chapter 5 Data Tables 163 Row State
- Page 181 and 182:
Chapter 5 Data Tables 165 Row State
- Page 183 and 184:
Chapter 5 Data Tables 167 Row State
- Page 185 and 186:
Chapter 5 Data Tables 169 Row State
- Page 187 and 188:
Chapter 5 Data Tables 171 Calculati
- Page 189:
Chapter 5 Data Tables 173 Calculati
- Page 192 and 193:
Contents Scripting analysis platfor
- Page 194 and 195:
178 Scripting Platforms Chapter 6 S
- Page 196 and 197:
180 Scripting Platforms Chapter 6 S
- Page 198 and 199:
182 Scripting Platforms Chapter 6 S
- Page 200 and 201:
184 Scripting Platforms Chapter 6 S
- Page 202 and 203:
186 Scripting Platforms Chapter 6 S
- Page 204 and 205:
188 Scripting Platforms Chapter 6 S
- Page 206 and 207:
190 Scripting Platforms Chapter 6 S
- Page 208 and 209:
192 Scripting Platforms Chapter 6 S
- Page 210 and 211:
194 Scripting Platforms Chapter 6 S
- Page 212 and 213:
196 Scripting Platforms Chapter 6 S
- Page 214 and 215:
198 Scripting Platforms Chapter 6 S
- Page 216 and 217:
200 Scripting Platforms Chapter 6 S
- Page 218 and 219:
202 Scripting Platforms Chapter 6 S
- Page 220 and 221:
204 Scripting Platforms Chapter 6 S
- Page 222 and 223:
206 Scripting Platforms Chapter 6 S
- Page 224 and 225:
208 Scripting Platforms Chapter 6 S
- Page 226 and 227:
210 Scripting Platforms Chapter 6 S
- Page 228 and 229:
212 Scripting Platforms Chapter 6 S
- Page 230 and 231:
214 Scripting Platforms Chapter 6 S
- Page 232 and 233:
216 Scripting Platforms Chapter 6 S
- Page 234 and 235:
218 Scripting Platforms Chapter 6 S
- Page 236 and 237:
220 Scripting Platforms Chapter 6 S
- Page 238 and 239:
222 Scripting Platforms Chapter 6 S
- Page 240 and 241:
224 Scripting Platforms Chapter 6 S
- Page 243 and 244:
Chapter 7 Display Trees Create and
- Page 245 and 246:
Chapter 7 Display Trees 229 Manipul
- Page 247 and 248:
Chapter 7 Display Trees 231 Manipul
- Page 249 and 250:
Chapter 7 Display Trees 233 Manipul
- Page 251 and 252:
Chapter 7 Display Trees 235 Manipul
- Page 253 and 254:
Chapter 7 Display Trees 237 Manipul
- Page 255 and 256:
Chapter 7 Display Trees 239 Manipul
- Page 257 and 258:
Chapter 7 Display Trees 241 Manipul
- Page 259 and 260:
Chapter 7 Display Trees 243 Constru
- Page 261 and 262:
Chapter 7 Display Trees 245 Constru
- Page 263 and 264:
Chapter 7 Display Trees 247 Constru
- Page 265 and 266:
Chapter 7 Display Trees 249 Constru
- Page 267 and 268:
Chapter 7 Display Trees 251 Constru
- Page 269 and 270:
Chapter 7 Display Trees 253 Constru
- Page 271 and 272:
Chapter 7 Display Trees 255 Constru
- Page 273 and 274:
Chapter 7 Display Trees 257 Constru
- Page 275 and 276:
Chapter 7 Display Trees 259 Constru
- Page 277 and 278:
Chapter 7 Display Trees 261 Constru
- Page 279 and 280:
Chapter 7 Display Trees 263 Constru
- Page 281 and 282:
Chapter 7 Display Trees 265 Constru
- Page 283 and 284:
Chapter 7 Display Trees 267 Constru
- Page 285 and 286:
Chapter 7 Display Trees 269 Modal D
- Page 287 and 288:
Chapter 7 Display Trees 271 Modal D
- Page 289 and 290:
Chapter 7 Display Trees 273 Modal D
- Page 291 and 292:
Chapter 7 Display Trees 275 Modal D
- Page 293 and 294:
Chapter 7 Display Trees 277 Modal D
- Page 295 and 296:
Chapter 7 Display Trees 279 Modal D
- Page 297:
Chapter 7 Display Trees 281 Scripti
- Page 300 and 301:
Contents Adding Scripts to Graphs .
- Page 302 and 303:
286 Scripting Graphs Chapter 8 Addi
- Page 304 and 305:
288 Scripting Graphs Chapter 8 Grap
- Page 306 and 307:
290 Scripting Graphs Chapter 8 Grap
- Page 308 and 309:
292 Scripting Graphs Chapter 8 Grap
- Page 310 and 311:
294 Scripting Graphs Chapter 8 Draw
- Page 312 and 313:
296 Scripting Graphs Chapter 8 Draw
- Page 314 and 315:
298 Scripting Graphs Chapter 8 Draw
- Page 316 and 317:
300 Scripting Graphs Chapter 8 Draw
- Page 318 and 319:
302 Scripting Graphs Chapter 8 Draw
- Page 320 and 321:
304 Scripting Graphs Chapter 8 Draw
- Page 322 and 323:
306 Scripting Graphs Chapter 8 Draw
- Page 324 and 325:
308 Scripting Graphs Chapter 8 Inte
- Page 326 and 327:
310 Scripting Graphs Chapter 8 Inte
- Page 328 and 329:
312 Scripting Graphs Chapter 8 Inte
- Page 331 and 332:
Chapter 9 Three-Dimensional Scenes
- Page 333 and 334:
Chapter 9 Three-Dimensional Scenes
- Page 335 and 336:
Chapter 9 Three-Dimensional Scenes
- Page 337 and 338:
Chapter 9 Three-Dimensional Scenes
- Page 339 and 340:
Chapter 9 Three-Dimensional Scenes
- Page 341 and 342:
Then use one of these projections:
- Page 343 and 344:
Chapter 9 Three-Dimensional Scenes
- Page 345 and 346:
Chapter 9 Three-Dimensional Scenes
- Page 347 and 348:
Chapter 9 Three-Dimensional Scenes
- Page 349 and 350:
Chapter 9 Three-Dimensional Scenes
- Page 351 and 352:
Chapter 9 Three-Dimensional Scenes
- Page 353 and 354:
Chapter 9 Three-Dimensional Scenes
- Page 355 and 356:
Chapter 9 Three-Dimensional Scenes
- Page 357 and 358:
Chapter 9 Three-Dimensional Scenes
- Page 359 and 360:
Chapter 9 Three-Dimensional Scenes
- Page 361 and 362:
Chapter 9 Three-Dimensional Scenes
- Page 363 and 364:
Chapter 9 Three-Dimensional Scenes
- Page 365 and 366:
Chapter 9 Three-Dimensional Scenes
- Page 367 and 368:
Chapter 9 Three-Dimensional Scenes
- Page 369:
Chapter 9 Three-Dimensional Scenes
- Page 372 and 373:
Contents Basics . . . . . . . . . .
- Page 374 and 375:
358 Matrices Chapter 10 Basics Cons
- Page 376 and 377:
360 Matrices Chapter 10 Basics perf
- Page 378 and 379:
362 Matrices Chapter 10 Basics v=ve
- Page 380 and 381:
364 Matrices Chapter 10 Basics Oper
- Page 382 and 383:
366 Matrices Chapter 10 Matrix oper
- Page 384 and 385:
368 Matrices Chapter 10 Matrix oper
- Page 386 and 387:
370 Matrices Chapter 10 Matrix oper
- Page 388 and 389:
372 Matrices Chapter 10 Matrix oper
- Page 390 and 391:
374 Matrices Chapter 10 Matrix oper
- Page 392 and 393:
376 Matrices Chapter 10 Statistical
- Page 394 and 395:
378 Matrices Chapter 10 Statistical
- Page 397 and 398:
Chapter 11 Production Environments
- Page 399 and 400:
Chapter 11 Production Environments
- Page 401 and 402:
Chapter 11 Production Environments
- Page 403 and 404:
Chapter 11 Production Environments
- Page 405 and 406:
Chapter 11 Production Environments
- Page 407 and 408:
Chapter 11 Production Environments
- Page 409 and 410:
Chapter 11 Production Environments
- Page 411 and 412:
Chapter 11 Production Environments
- Page 413 and 414:
Chapter 11 Production Environments
- Page 415 and 416:
Chapter 11 Production Environments
- Page 417 and 418:
Chapter 11 Production Environments
- Page 419 and 420:
Chapter 11 Production Environments
- Page 421 and 422:
Chapter 11 Production Environments
- Page 423 and 424:
Chapter 12 Advanced Concepts Comple
- Page 425 and 426:
Chapter 12 Advanced Concepts 409 Ad
- Page 427 and 428:
Chapter 12 Advanced Concepts 411 Ad
- Page 429 and 430:
Chapter 12 Advanced Concepts 413 Ad
- Page 431 and 432:
Chapter 12 Advanced Concepts 415 En
- Page 433 and 434:
Chapter 12 Advanced Concepts 417 XM
- Page 435 and 436:
Chapter 12 Advanced Concepts 419 XM
- Page 437 and 438:
Chapter 12 Advanced Concepts 421 Pa
- Page 439 and 440:
Chapter 12 Advanced Concepts 423 Li
- Page 441 and 442:
Chapter 12 Advanced Concepts 425 Li
- Page 443 and 444:
Chapter 12 Advanced Concepts 427 Li
- Page 445 and 446:
Chapter 12 Advanced Concepts 429 Li
- Page 447 and 448:
Chapter 12 Advanced Concepts 431 Li
- Page 449 and 450:
Chapter 12 Advanced Concepts 433 Li
- Page 451 and 452:
Chapter 12 Advanced Concepts 435 Li
- Page 453 and 454:
Chapter 12 Advanced Concepts 437 He
- Page 455 and 456:
Chapter 12 Advanced Concepts 439 Ad
- Page 457 and 458:
Chapter 12 Advanced Concepts 441 Ad
- Page 459:
Chapter 12 Advanced Concepts 443 Ad
- Page 462 and 463:
Contents Functions, Variables, and
- Page 464 and 465:
448 JSL Syntax Reference Appendix A
- Page 466 and 467:
450 JSL Syntax Reference Appendix A
- Page 468 and 469:
452 JSL Syntax Reference Appendix A
- Page 470 and 471:
454 JSL Syntax Reference Appendix A
- Page 472 and 473:
456 JSL Syntax Reference Appendix A
- Page 474 and 475:
458 JSL Syntax Reference Appendix A
- Page 476 and 477:
460 JSL Syntax Reference Appendix A
- Page 478 and 479:
462 JSL Syntax Reference Appendix A
- Page 480 and 481:
464 JSL Syntax Reference Appendix A
- Page 482 and 483:
466 JSL Syntax Reference Appendix A
- Page 484 and 485:
468 JSL Syntax Reference Appendix A
- Page 486 and 487:
470 JSL Syntax Reference Appendix A
- Page 488 and 489:
472 JSL Syntax Reference Appendix A
- Page 490 and 491:
474 JSL Syntax Reference Appendix A
- Page 492 and 493:
476 JSL Syntax Reference Appendix A
- Page 494 and 495:
478 JSL Syntax Reference Appendix A
- Page 496 and 497:
480 JSL Syntax Reference Appendix A
- Page 498 and 499:
482 JSL Syntax Reference Appendix A
- Page 500 and 501:
484 JSL Syntax Reference Appendix A
- Page 502 and 503:
486 JSL Syntax Reference Appendix A
- Page 504 and 505:
488 JSL Syntax Reference Appendix A
- Page 506 and 507:
490 JSL Syntax Reference Appendix A
- Page 508 and 509:
492 JSL Syntax Reference Appendix A
- Page 510 and 511:
494 JSL Syntax Reference Appendix A
- Page 512 and 513:
496 JSL Syntax Reference Appendix A
- Page 514 and 515:
498 JSL Syntax Reference Appendix A
- Page 516 and 517:
500 JSL Syntax Reference Appendix A
- Page 518 and 519:
502 JSL Syntax Reference Appendix A
- Page 520 and 521:
504 JSL Syntax Reference Appendix A
- Page 522 and 523:
506 JSL Syntax Reference Appendix A
- Page 524 and 525:
508 JSL Syntax Reference Appendix A
- Page 526 and 527:
510 JSL Syntax Reference Appendix A
- Page 528 and 529:
512 JSL Syntax Reference Appendix A
- Page 530 and 531:
514 JSL Syntax Reference Appendix A
- Page 532 and 533:
516 JSL Syntax Reference Appendix A
- Page 534 and 535:
518 JSL Syntax Reference Appendix A
- Page 536 and 537:
520 JSL Syntax Reference Appendix A
- Page 538 and 539:
522 JSL Syntax Reference Appendix A
- Page 540 and 541:
524 JSL Syntax Reference Appendix A
- Page 542 and 543:
526 JSL Syntax Reference Appendix A
- Page 544 and 545:
528 JSL Syntax Reference Appendix A
- Page 546 and 547:
530 JSL Syntax Reference Appendix A
- Page 548 and 549:
532 JSL Syntax Reference Appendix A
- Page 550 and 551:
534 JSL Syntax Reference Appendix A
- Page 552 and 553:
536 JSL Syntax Reference Appendix A
- Page 554 and 555:
538 JSL Syntax Reference Appendix A
- Page 556 and 557:
540 JSL Syntax Reference Appendix A
- Page 558 and 559:
542 JSL Syntax Reference Appendix A
- Page 560 and 561:
544 JSL Syntax Reference Appendix A
- Page 562 and 563:
546 JSL Syntax Reference Appendix A
- Page 564 and 565:
548 JSL Syntax Reference Appendix A
- Page 566 and 567:
550 JSL Syntax Reference Appendix A
- Page 568 and 569:
552 JSL Syntax Reference Appendix A
- Page 570 and 571:
554 JSL Syntax Reference Appendix A
- Page 572 and 573:
556 JSL Syntax Reference Appendix A
- Page 574 and 575:
558 JSL Syntax Reference Appendix A
- Page 576 and 577:
560 JSL Syntax Reference Appendix A
- Page 578 and 579:
562 JSL Syntax Reference Appendix A
- Page 580 and 581:
564 JSL Syntax Reference Appendix A
- Page 582 and 583:
566 JSL Syntax Reference Appendix A
- Page 584 and 585:
568 JSL Syntax Reference Appendix A
- Page 586 and 587:
570 JSL Syntax Reference Appendix A
- Page 588 and 589:
572 JSL Syntax Reference Appendix A
- Page 590 and 591:
574 JSL Syntax Reference Appendix A
- Page 592 and 593:
576 JSL Syntax Reference Appendix A
- Page 594 and 595:
578 JSL Syntax Reference Appendix A
- Page 596 and 597:
580 JSL Syntax Reference Appendix A
- Page 598 and 599:
582 JSL Syntax Reference Appendix A
- Page 600 and 601:
584 JSL Syntax Reference Appendix A
- Page 602 and 603:
586 JSL Syntax Reference Appendix A
- Page 604 and 605:
588 JSL Syntax Reference Appendix A
- Page 606 and 607:
590 JSL Syntax Reference Appendix A
- Page 608 and 609:
592 JSL Syntax Reference Appendix A
- Page 610 and 611:
594 JSL Syntax Reference Appendix A
- Page 612 and 613:
596 JSL Syntax Reference Appendix A
- Page 614 and 615:
598 JSL Syntax Reference Appendix A
- Page 616 and 617:
600 JSL Syntax Reference Appendix A
- Page 618 and 619:
602 JSL Syntax Reference Appendix A
- Page 620 and 621:
604 JSL Syntax Reference Appendix A
- Page 622 and 623:
606 JSL Syntax Reference Appendix A
- Page 624 and 625:
608 JSL Syntax Reference Appendix A
- Page 626 and 627:
610 JSL Syntax Reference Appendix A
- Page 628 and 629:
612 JSL Syntax Reference Appendix A
- Page 630 and 631:
614 JSL Syntax Reference Appendix A
- Page 632 and 633:
616 JSL Syntax Reference Appendix A
- Page 634 and 635:
618 JSL Syntax Reference Appendix A
- Page 636 and 637:
620 JSL Syntax Reference Appendix A
- Page 638 and 639:
622 JSL Syntax Reference Appendix A
- Page 640 and 641:
624 JSL Syntax Reference Appendix A
- Page 642 and 643:
626 JSL Syntax Reference Appendix A
- Page 644 and 645:
628 JSL Syntax Reference Appendix A
- Page 646 and 647:
630 JSL Syntax Reference Appendix A
- Page 648 and 649:
632 JSL Syntax Reference Appendix A
- Page 650 and 651:
634 JSL Syntax Reference Appendix A
- Page 652 and 653:
636 JSL Syntax Reference Appendix A
- Page 654 and 655:
638 JSL Syntax Reference Appendix A
- Page 656 and 657:
640 JSL Syntax Reference Appendix A
- Page 658 and 659:
642 JSL Syntax Reference Appendix A
- Page 661 and 662:
Appendix B Glossary Terms, concepts
- Page 663:
Appendix B Glossary 647 object An o
- Page 666 and 667:
650 Index Beta Binomial Probability
- Page 668 and 669:
652 Index Greater or Equal 479 H H
- Page 670 and 671:
654 Index Normal Biv Distribution 5
- Page 672 and 673:
656 Index Send 545 Sequence 531 Set
- Page 675 and 676:
Index JMP Scripting Guide Symbols !
- Page 677 and 678:
Index 661 Hierarchical 211 K-Means
- Page 679 and 680:
Index 663 Dispatch 235 display 18,
- Page 681 and 682:
Index 665 Go To Row 137 Gradient Fu
- Page 683 and 684:
Index 667 range checks 365 ranges o
- Page 685 and 686:
Index 669 Partial Disk 337 Partial
- Page 687 and 688:
Index 671 running a script at start
- Page 689 and 690:
Index 673 text boxes messages 552 t