Property valuation in the Nordic countries - KTI
Property valuation in the Nordic countries - KTI
Property valuation in the Nordic countries - KTI

Create successful ePaper yourself
Turn your PDF publications into a flip-book with our unique Google optimized e-Paper software.
2<br />
The performance of <strong>the</strong> <strong>Nordic</strong><br />
property markets<br />
The <strong>Nordic</strong> <strong>countries</strong> (Denmark, F<strong>in</strong>land, Norway and Sweden) have performed ra<strong>the</strong>r well <strong>in</strong> <strong>the</strong><br />
economic turmoil <strong>in</strong> recent years. Although <strong>the</strong> <strong>countries</strong> differ from each o<strong>the</strong>r <strong>in</strong> terms of e.g.<br />
structure of <strong>the</strong> economy and used currency, as well as <strong>the</strong> structure and market practices <strong>in</strong> <strong>the</strong><br />
property markets, <strong>the</strong>y are often seen as a unified market area by <strong>in</strong>ternational property <strong>in</strong>vestors.<br />
Of <strong>the</strong> four <strong>countries</strong>, Sweden has attracted <strong>the</strong> most foreign capital, followed by F<strong>in</strong>land, whereas<br />
Norway and Denmark have rema<strong>in</strong>ed more dom<strong>in</strong>ated by domestic players.<br />
The stability of <strong>the</strong> economies has had a positive <strong>in</strong>fluence on <strong>the</strong> <strong>Nordic</strong> property <strong>in</strong>vestment<br />
markets. Domestic <strong>in</strong>vestors have ma<strong>in</strong>ta<strong>in</strong>ed <strong>the</strong>ir competitiveness, and also <strong>in</strong>ternational<br />
<strong>in</strong>vestors consider <strong>the</strong> <strong>Nordic</strong> area as a safe haven <strong>in</strong> <strong>the</strong> current European property market platform<br />
- a region where fair and stable returns with relatively low risk are possible to obta<strong>in</strong>. However, <strong>the</strong><br />
size and liquidity of <strong>the</strong> markets rema<strong>in</strong> <strong>the</strong> ma<strong>in</strong> challenge of <strong>the</strong> <strong>Nordic</strong> property markets.<br />
2.1 Stable property returns <strong>in</strong> all <strong>Nordic</strong> <strong>countries</strong><br />
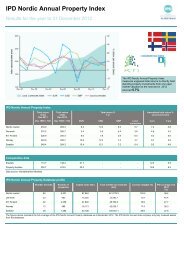
The total returns have rema<strong>in</strong>ed ra<strong>the</strong>r attractive <strong>in</strong> <strong>the</strong> <strong>Nordic</strong> property market accord<strong>in</strong>g to <strong>the</strong><br />
IPD and <strong>KTI</strong> <strong>in</strong>dices. In 2011, Sweden was <strong>the</strong> best perform<strong>in</strong>g country <strong>in</strong> Europe, produc<strong>in</strong>g a total<br />
return of 10.2%. Norway, F<strong>in</strong>land and Denmark also performed relatively well, with total returns<br />
of 7.4%, 6.0% and 4.7%, respectively. In total, <strong>Nordic</strong> <strong>countries</strong> produced a total return of 7.9%,<br />
consist<strong>in</strong>g of an <strong>in</strong>come return of 5.4%, and capital growth of 2.4%. The best perform<strong>in</strong>g sector <strong>in</strong><br />
2011 was <strong>the</strong> Swedish retail sector, followed by Swedish offices and <strong>in</strong>dustrial properties, as well<br />
as F<strong>in</strong>nish residential properties. In <strong>the</strong> o<strong>the</strong>r end, Danish residential, F<strong>in</strong>nish office and Danish<br />
<strong>in</strong>dustrial sectors produced <strong>the</strong> lowest total returns, due to negative capital growth.<br />
In <strong>the</strong> longer perspective, <strong>the</strong> Swedish and Norwegian property markets have shown higher<br />
volatility than Denmark and F<strong>in</strong>land. However, <strong>the</strong> differences <strong>in</strong> total returns have been ra<strong>the</strong>r<br />
small: <strong>the</strong> annualised total returns <strong>in</strong> a 12 year period (from 2000 to 2011) ranges from 9.4% <strong>in</strong><br />
Norway to 7.1% <strong>in</strong> F<strong>in</strong>land, with <strong>the</strong> annualised total return of 8.1% <strong>in</strong> <strong>the</strong> <strong>Nordic</strong>s. The reason for<br />
F<strong>in</strong>land’s lower returns has been capital growth that has averaged only 0.4% annually. In o<strong>the</strong>r<br />
<strong>Nordic</strong> <strong>countries</strong> <strong>the</strong> annualised capital growth has been between 2.4% and 3.1%. Income return<br />
has, however, traditionally been <strong>the</strong> highest <strong>in</strong> F<strong>in</strong>land.<br />
2.2 Transactions volume <strong>in</strong>creas<strong>in</strong>g<br />
The total annual transactions volumes of <strong>the</strong> <strong>Nordic</strong> region have rema<strong>in</strong>ed well above 10 billion<br />
euro, with <strong>the</strong> only exception occurr<strong>in</strong>g <strong>in</strong> 2009, when annual volume dropped to ca. five billion<br />
euro, due to <strong>the</strong> f<strong>in</strong>ancial crisis. In 2011, <strong>the</strong> <strong>Nordic</strong> transactions volume amounted to ca. EUR 15<br />
billion, accord<strong>in</strong>g to DTZ. The <strong>in</strong>vestors have targeted especially Sweden that has climbed up to<br />
<strong>the</strong> top five <strong>countries</strong> <strong>in</strong> <strong>the</strong> property transactions volumes <strong>in</strong> Europe.<br />
6 <strong>Property</strong> <strong>valuation</strong> <strong>in</strong> <strong>the</strong> <strong>Nordic</strong> <strong>countries</strong>