regional formation and development studies - KlaipÄdos universitetas
regional formation and development studies - KlaipÄdos universitetas
regional formation and development studies - KlaipÄdos universitetas

Create successful ePaper yourself
Turn your PDF publications into a flip-book with our unique Google optimized e-Paper software.
ISSN 2029-9370. Regional Formation <strong>and</strong> Development Studies, No. 2 (7)<br />
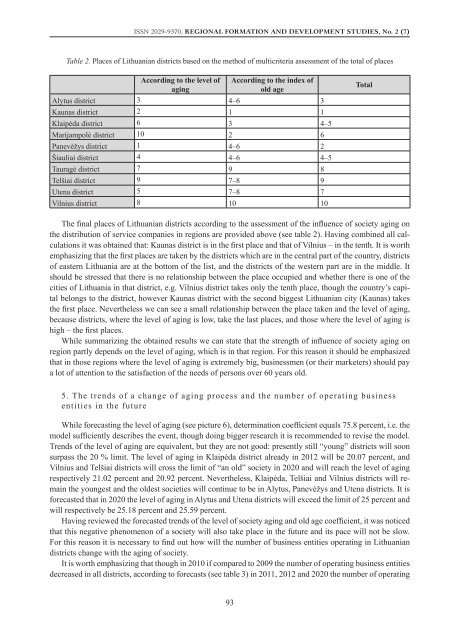
Table 2. Places of Lithuanian districts based on the method of multicriteria assessment of the total of places<br />
According to the level of<br />
aging<br />
According to the index of<br />
old age<br />
Alytus district 3 4–6 3<br />
Kaunas district 2 1 1<br />
Klaipėda district 6 3 4–5<br />
Marijampolė district 10 2 6<br />
Panevėžys district 1 4–6 2<br />
Šiauliai district 4 4–6 4–5<br />
Tauragė district 7 9 8<br />
Telšiai district 9 7–8 9<br />
Utena district 5 7–8 7<br />
Vilnius district 8 10 10<br />
Total<br />
The final places of Lithuanian districts according to the assessment of the influence of society aging on<br />
the distribution of service companies in regions are provided above (see table 2). Having combined all calculations<br />
it was obtained that: Kaunas district is in the first place <strong>and</strong> that of Vilnius – in the tenth. It is worth<br />
emphasizing that the first places are taken by the districts which are in the central part of the country, districts<br />
of eastern Lithuania are at the bottom of the list, <strong>and</strong> the districts of the western part are in the middle. It<br />
should be stressed that there is no relationship between the place occupied <strong>and</strong> whether there is one of the<br />
cities of Lithuania in that district, e.g. Vilnius district takes only the tenth place, though the country’s capital<br />
belongs to the district, however Kaunas district with the second biggest Lithuanian city (Kaunas) takes<br />
the first place. Nevertheless we can see a small relationship between the place taken <strong>and</strong> the level of aging,<br />
because districts, where the level of aging is low, take the last places, <strong>and</strong> those where the level of aging is<br />
high – the first places.<br />
While summarizing the obtained results we can state that the strength of influence of society aging on<br />
region partly depends on the level of aging, which is in that region. For this reason it should be emphasized<br />
that in those regions where the level of aging is extremely big, businessmen (or their marketers) should pay<br />
a lot of attention to the satisfaction of the needs of persons over 60 years old.<br />
5. The trends of a change of aging process <strong>and</strong> the number of operating business<br />
entities in the future<br />
While forecasting the level of aging (see picture 6), determination coefficient equals 75.8 percent, i.e. the<br />
model sufficiently describes the event, though doing bigger research it is recommended to revise the model.<br />
Trends of the level of aging are equivalent, but they are not good: presently still “young” districts will soon<br />
surpass the 20 % limit. The level of aging in Klaipėda district already in 2012 will be 20.07 percent, <strong>and</strong><br />
Vilnius <strong>and</strong> Telšiai districts will cross the limit of “an old” society in 2020 <strong>and</strong> will reach the level of aging<br />
respectively 21.02 percent <strong>and</strong> 20.92 percent. Nevertheless, Klaipėda, Telšiai <strong>and</strong> Vilnius districts will remain<br />
the youngest <strong>and</strong> the oldest societies will continue to be in Alytus, Panevėžys <strong>and</strong> Utena districts. It is<br />
forecasted that in 2020 the level of aging in Alytus <strong>and</strong> Utena districts will exceed the limit of 25 percent <strong>and</strong><br />
will respectively be 25.18 percent <strong>and</strong> 25.59 percent.<br />
Having reviewed the forecasted trends of the level of society aging <strong>and</strong> old age coefficient, it was noticed<br />
that this negative phenomenon of a society will also take place in the future <strong>and</strong> its pace will not be slow.<br />
For this reason it is necessary to find out how will the number of business entities operating in Lithuanian<br />
districts change with the aging of society.<br />
It is worth emphasizing that though in 2010 if compared to 2009 the number of operating business entities<br />
decreased in all districts, according to forecasts (see table 3) in 2011, 2012 <strong>and</strong> 2020 the number of operating<br />
93