Community Health Needs Assessment 2012 - Saint Joseph Hospital
Community Health Needs Assessment 2012 - Saint Joseph Hospital
Community Health Needs Assessment 2012 - Saint Joseph Hospital

Create successful ePaper yourself
Turn your PDF publications into a flip-book with our unique Google optimized e-Paper software.
<strong>Community</strong> <strong>Health</strong> <strong>Needs</strong> <strong>Assessment</strong> 2013<br />
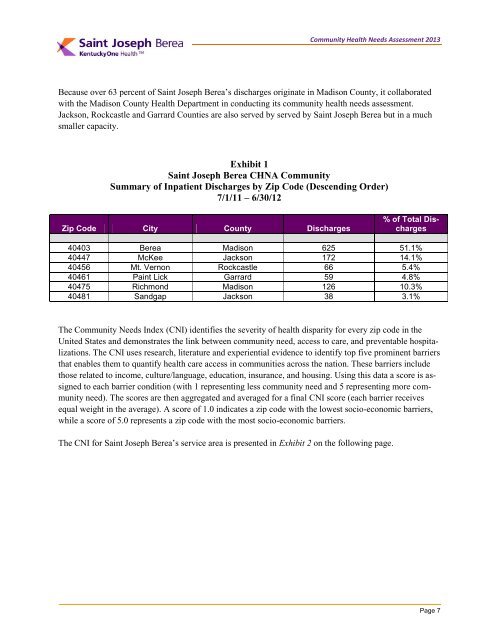
Because over 63 percent of <strong>Saint</strong> <strong>Joseph</strong> Berea’s discharges originate in Madison County, it collaborated<br />
with the Madison County <strong>Health</strong> Department in conducting its community health needs assessment.<br />
Jackson, Rockcastle and Garrard Counties are also served by served by <strong>Saint</strong> <strong>Joseph</strong> Berea but in a much<br />
smaller capacity.<br />
Exhibit 1<br />
<strong>Saint</strong> <strong>Joseph</strong> Berea CHNA <strong>Community</strong><br />
Summary of Inpatient Discharges by Zip Code (Descending Order)<br />
7/1/11 – 6/30/12<br />
Zip Code City County Discharges<br />
% of Total Discharges<br />
40403 Berea Madison 625 51.1%<br />
40447 McKee Jackson 172 14.1%<br />
40456 Mt. Vernon Rockcastle 66 5.4%<br />
40461 Paint Lick Garrard 59 4.8%<br />
40475 Richmond Madison 126 10.3%<br />
40481 Sandgap Jackson 38 3.1%<br />
The <strong>Community</strong> <strong>Needs</strong> Index (CNI) identifies the severity of health disparity for every zip code in the<br />
United States and demonstrates the link between community need, access to care, and preventable hospitalizations.<br />
The CNI uses research, literature and experiential evidence to identify top five prominent barriers<br />
that enables them to quantify health care access in communities across the nation. These barriers include<br />
those related to income, culture/language, education, insurance, and housing. Using this data a score is assigned<br />
to each barrier condition (with 1 representing less community need and 5 representing more community<br />
need). The scores are then aggregated and averaged for a final CNI score (each barrier receives<br />
equal weight in the average). A score of 1.0 indicates a zip code with the lowest socio-economic barriers,<br />
while a score of 5.0 represents a zip code with the most socio-economic barriers.<br />
The CNI for <strong>Saint</strong> <strong>Joseph</strong> Berea’s service area is presented in Exhibit 2 on the following page.<br />
Page 7