Community Health Needs Assessment 2012 - Saint Joseph Hospital
Community Health Needs Assessment 2012 - Saint Joseph Hospital
Community Health Needs Assessment 2012 - Saint Joseph Hospital

Create successful ePaper yourself
Turn your PDF publications into a flip-book with our unique Google optimized e-Paper software.
<strong>Community</strong> <strong>Health</strong> <strong>Needs</strong> <strong>Assessment</strong> 2013<br />
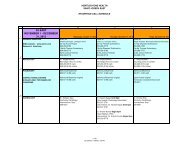
Exhibit 12<br />
<strong>Saint</strong> <strong>Joseph</strong> Berea CHNA <strong>Community</strong><br />
<strong>Health</strong> Factors (<strong>2012</strong>)<br />
Garrard Jackson Madison Rockcastle National<br />
County County County County KY Benchmark<br />
<strong>Health</strong> Behaviors<br />
Adult smoking - Percent of adults that report<br />
smoking at least 100 cigarettes and that they currently<br />
smoke 0.0% 35.0% 22.0% 32.0% 27.0% 14.0%<br />
Adult obesity - Percent of adults that report a<br />
BMI >= 30 33.0% 33.0% 30.0% 36.0% 33.0% 25.0%<br />
Physical inactivity - Percent of adults aged 20<br />
and over reporting no leisure time physical activity 36.0% 37.0% 30.0% 38.0% 31.0% 21.0%<br />
Excessive drinking - Percent of adults that report<br />
excessive drinking in the past 30 days 10.0% 6.0% 10.0% 10.7% 8.0%<br />
Motor vehicle crash death rate - Motor vehicle<br />
deaths per 100K population 16.0 43.0 16.0 32.0 22 12<br />
Sexually transmitted infections - Chlamydia rate<br />
per 100K population 188.0 147.0 223.0 83.0 311 84<br />
Teen birth rate - Per 1,000 female population,<br />
ages 15-19 48.0 62.0 33.0 62.0 52 22<br />
Clinical Care<br />
Uninsured - Percent of population under age 65<br />
without health insurance 20.0% 21.0% 18.0% 20.0% 17.0% 11.0%<br />
Primary care physicians - Ratio of population to<br />
primary care physicians 2,431:1 13,385:1 1,679:1 1,664:1 1232:1 631:1<br />
Preventable hospital stays - <strong>Hospital</strong>ization rate<br />
for ambulatory-care sensitive conditions per 1,000<br />
Medicare enrollees 88.0 102.0 66.0 186.0 104 49<br />
Diabetic screening - Percent of diabetic Medicare<br />
enrollees that receive HbA1c screening 90.0% 85.0% 88.0% 80.0% 82.0% 89.0%<br />
Mammography screening - Percent of female<br />
Medicare enrollees that receive mammography<br />
screening 61.0% 49.0% 61.0% 56.0% 63.0% 74.0%<br />
Social & Economic Factors<br />
High school graduation - Percent of ninth grade<br />
cohort that graduates in 4 years 73.0% 72.0% 77.0% 83.0% 78.0%<br />
Some college - Percent of adults aged 25-44<br />
years with some post-secondary education 43.0% 35.0% 62.0% 39.0% 55.0% 68.0%<br />
Unemployment - Percent of population age 16+<br />
unemployed but seeking work 11.8% 17.1% 8.8% 11.3% 10.5% 5.4%<br />
Children in poverty - Percent of children under<br />
age 18 in<br />
poverty 26% 40% 25.0% 35.0% 26.0% 13.0%<br />
Inadequate social support - Percent of adults<br />
without social/emotional support 26.0% 17.0% 26.0% 20.0% 14.0%<br />
Children in single-parent households - Percent<br />
of children that live in household headed by single<br />
parent 24.0% 34.0% 33.0% 24.0% 32.0% 20.0%<br />
Violent crime rate - Deaths due to homicide per<br />
100,000 population (age-adjusted) 67.0 35.0 204.0 87.0 288 73<br />
Physical Environment<br />
Air pollution-particulate matter days - Annual<br />
number of unhealthy air quality days due to fine<br />
particulate matter 0 0 0 0 2 -<br />
Air pollution-ozone days - Annual number of<br />
unhealthy air quality days due to ozone 0 0 0 0 2 -<br />
Access to recreational facilities - Rate of recreational<br />
facilities per 100,000 population 0.0% 0 13.0% 0 8 0.0%<br />
Limited access to healthy foods - Percent of<br />
population who are low-income and do not live<br />
close to a grocery store 0% 0% 0% 0% 7.0% 16<br />
Fast food restaurants - Percent of all restaurants<br />
that are fast-food establishments 50 50.0% 59.0% 41.0% 54.0% 25.0%<br />
Page 20