Silver Creek - Division of Water Quality - Utah.gov
Silver Creek - Division of Water Quality - Utah.gov
Silver Creek - Division of Water Quality - Utah.gov

You also want an ePaper? Increase the reach of your titles
YUMPU automatically turns print PDFs into web optimized ePapers that Google loves.
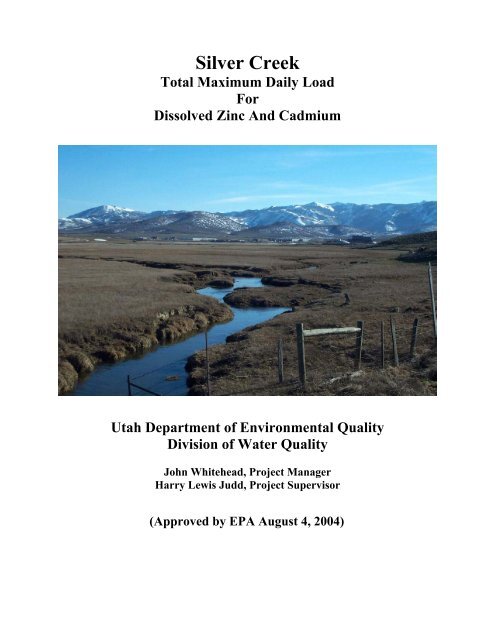
<strong>Silver</strong> <strong>Creek</strong><br />
Total Maximum Daily Load<br />
For<br />
Dissolved Zinc And Cadmium<br />
<strong>Utah</strong> Department <strong>of</strong> Environmental <strong>Quality</strong><br />
<strong>Division</strong> <strong>of</strong> <strong>Water</strong> <strong>Quality</strong><br />
John Whitehead, Project Manager<br />
Harry Lewis Judd, Project Supervisor<br />
(Approved by EPA August 4, 2004)
<strong>Utah</strong> Department <strong>of</strong> Environmental <strong>Quality</strong><br />
<strong>Division</strong> <strong>of</strong> <strong>Water</strong> <strong>Quality</strong><br />
TMDL Section<br />
<strong>Silver</strong> <strong>Creek</strong> Total Maximum Daily Load<br />
<strong>Water</strong>body ID<br />
Hydrologic Unit Code<br />
Location<br />
Pollutants <strong>of</strong> Concern<br />
Impaired Beneficial Uses<br />
Average Annual Load Reductions<br />
Defined Targets/Endpoints<br />
Implementation Strategy<br />
<strong>Silver</strong> <strong>Creek</strong><br />
16020101<br />
Summit County<br />
Dissolved Cadmium & Zinc<br />
Class 3A: Protected for cold water<br />
species <strong>of</strong> game fish and other cold<br />
water aquatic life<br />
Zinc: up to 8,300 lbs/yr. at<br />
Atkinson Station<br />
Cadmium: up to 15.8 lbs./yr. at<br />
Park City Station<br />
Zinc 0.39 mg/l<br />
Cadmium 0.0008 mg/l<br />
(Values adjusted for hardness <strong>of</strong> 400 mg/l)<br />
Table 13 shows target annual<br />
loads for 5 stations on <strong>Silver</strong><br />
<strong>Creek</strong>.<br />
Clean up or isolation <strong>of</strong> areas<br />
disturbed by historic mining<br />
activities (mine waste areas,<br />
tailings, contaminated sediments<br />
etc.)
<strong>Silver</strong> <strong>Creek</strong><br />
Total Maximum Daily Load<br />
For<br />
Dissolved Zinc And Cadmium<br />
Prepared For:<br />
<strong>Utah</strong> <strong>Division</strong> <strong>of</strong> <strong>Water</strong> <strong>Quality</strong><br />
288 North 1460 West<br />
Salt Lake City, <strong>Utah</strong> 84114<br />
Project Manager: John Whitehead<br />
Project Supervisor: Harry Judd<br />
Prepared By:<br />
Michael Baker Jr., Inc.<br />
6955 Union park Center, Suite 370<br />
Midvale, <strong>Utah</strong> 84047<br />
Psomas<br />
2825 E. Cottonwood Parkway, Suite 120<br />
Salt Lake City, <strong>Utah</strong> 84121
<strong>Silver</strong> <strong>Creek</strong> <strong>Water</strong>shed TMDL Final Report<br />
Table <strong>of</strong> Contents<br />
<strong>Silver</strong> <strong>Creek</strong> TMDL Executive Summary .................................................................................. 3<br />
1.0 INTRODUCTION ............................................................................................................ 7<br />
1.1 <strong>Water</strong>shed Description.................................................................................................... 7<br />
1.2 <strong>Water</strong> Budget .................................................................................................................. 9<br />
1.3 <strong>Water</strong> <strong>Quality</strong> Impairment ............................................................................................ 12<br />
1.4 Effects <strong>of</strong> Zinc and Cadmium....................................................................................... 12<br />
2.0 WATER QUALITY STANDARDS .............................................................................. 14<br />
2.1 <strong>Water</strong> <strong>Quality</strong> Targets and Endpoints........................................................................... 14<br />
3.0 WATER QUALITY DATA ........................................................................................... 17<br />
3.1 Sources <strong>of</strong> Data............................................................................................................. 17<br />
3.2 Data Limitations............................................................................................................ 17<br />
3.3 Key Sampling Locations............................................................................................... 18<br />
4.0 DATA ANALYSIS RESULTS....................................................................................... 20<br />
4.1 Zinc and Cadmium Standards....................................................................................... 20<br />
4.2 <strong>Water</strong> <strong>Quality</strong> and Flow Results by Location............................................................... 20<br />
4.4 Zinc and Cadmium Loading ......................................................................................... 29<br />
4.4 <strong>Water</strong> <strong>Quality</strong> Overview............................................................................................... 32<br />
4.5 Zinc and Cadmium Geochemistry Overview ............................................................... 33<br />
5.0 MARGIN OF SAFETY.................................................................................................. 34<br />
5.1 Assumptions.................................................................................................................. 34<br />
5.2 Margin <strong>of</strong> Safety ........................................................................................................... 34<br />
6.0 SOURCES........................................................................................................................ 35<br />
6.1 Known Sources <strong>of</strong> Contaminants.................................................................................. 35<br />
6.2 Future sources ............................................................................................................... 39<br />
7.0 TECHNICAL ANALYSIS............................................................................................. 41<br />
7.1 Estimation <strong>of</strong> Existing Load ......................................................................................... 41<br />
7.2 Comparison <strong>of</strong> Existing Load and Loading Capacity................................................... 41<br />
8.0 TMDL .............................................................................................................................. 43<br />
8.1 Zinc ............................................................................................................................... 44<br />
8.2 Cadmium....................................................................................................................... 44<br />
8.3 <strong>Silver</strong> <strong>Creek</strong> <strong>Water</strong> Reclamation Facility ..................................................................... 44<br />
9.0 BEST MANAGEMENT PRACTICES......................................................................... 47<br />
9.1 Source Control BMPs ................................................................................................... 47<br />
9.2 Treatment Control BMPs.............................................................................................. 48<br />
10.0 PROJECT IMPLEMENTATION PLAN..................................................................... 49<br />
10.1 Implementation Measures............................................................................................. 49<br />
10.2 Implementation Measures by Site................................................................................. 52<br />
10.3 Implementation Measures Efficiencies and Costs ........................................................ 56<br />
10.4 Implementation Schedule.............................................................................................. 60<br />
11.0 TMDL EVALUATION AND MONITORING PLAN ................................................ 61<br />
12.0 PUBLIC PARTICIPATION.......................................................................................... 62<br />
12.1 Public Participation Meetings....................................................................................... 62<br />
12.2 Subcommittees and Groups .......................................................................................... 62<br />
Page 1
<strong>Silver</strong> <strong>Creek</strong> <strong>Water</strong>shed TMDL Final Report<br />
13.0 REFERENCES................................................................................................................ 64<br />
APPENDIX A - DATA<br />
APPENDIX B – SEASONALITY AND STATISTICAL ANALYSIS OF UNCERTAINTY<br />
APPENDIX C – PUBLIC COMMENTS AND RESPONSIVENESS SUMMARY<br />
Page 2
<strong>Silver</strong> <strong>Creek</strong> TMDL Executive Summary<br />
(Relevant Section <strong>of</strong> TMDL Report in Parentheses)<br />
I. Introduction<br />
(See Section 1.0 for details)<br />
<strong>Silver</strong> <strong>Creek</strong> <strong>Water</strong>shed TMDL Final Report<br />
<strong>Silver</strong> <strong>Creek</strong> <strong>Water</strong>shed - USGS Hydrologic Unit Code (HUC) #16020101<br />
- <strong>Utah</strong> <strong>Water</strong>body ID # UT16020101-020 (see Figure 1)<br />
- Located entirely within Summit County <strong>Utah</strong><br />
Listing & Priority: <strong>Silver</strong> <strong>Creek</strong> from the confluence with the Weber River to its<br />
headwaters is listed on <strong>Utah</strong>’s 1998, 2000, and 2002 303(d) list <strong>of</strong> impaired water bodies.<br />
This waterbody is included in the “high priority” group on <strong>Utah</strong>’s 303(d) list indicating a<br />
Total Maximum Daily Load (TMDL) should be completed at this time.<br />
<strong>Water</strong> quality impairments:<br />
Beneficial Uses Impaired:<br />
Zinc & Cadmium<br />
Class 3A – cold water species <strong>of</strong> game fish & aquatic life<br />
II. <strong>Water</strong> <strong>Quality</strong> Standards<br />
(See Section 2.0 for details)<br />
R317-2-14 provides the numeric water quality standards for zinc and cadmium. Standards for<br />
zinc and cadmium are based on hardness. Pursuant to 303 (d) listing methodology now used by<br />
<strong>Utah</strong>, the chronic water quality standards are used for this TMDL. Using a hardness <strong>of</strong> 400<br />
mg/l, the chronic water quality standards for zinc and cadmium are 0.39 mg/l and 0.0008 mg/l<br />
respectively.<br />
III. <strong>Water</strong> <strong>Quality</strong> Standards Target<br />
(See Sections 2.0 & 3.0 for details)<br />
The hardness adjusted chronic water quality standards for zinc and cadmium will be used as the<br />
targets or endpoints for this TMDL.<br />
Pollutant <strong>of</strong> Concern Hardness Adjusted Chronic<br />
<strong>Water</strong> <strong>Quality</strong> Standard Target<br />
Zinc<br />
Cadmium<br />
0.39 mg/l<br />
0.0008 mg/l<br />
Page 3
<strong>Silver</strong> <strong>Creek</strong> <strong>Water</strong>shed TMDL Final Report<br />
IV. Significant Sources<br />
(See Section 6.0 for details)<br />
Historical evidence indicates the source <strong>of</strong> metals <strong>of</strong> concern in this watershed are from historical<br />
mining activities in the Park City area. Most <strong>of</strong> the mining activity occurred within the upper<br />
watershed, primarily within Empire Canyon. Tailings from these mines were stored onsite or<br />
removed to another location, typically downstream. Significant source areas for zinc and<br />
cadmium are identified on Figure 22 and summarized in the following table:<br />
Description<br />
Upper <strong>Water</strong>shed Sources<br />
Prospector Square<br />
<strong>Silver</strong> Maple Claims<br />
Flood Plain Tails<br />
Richardson Flats<br />
Meadow Area<br />
Owner<br />
United Park City Mines<br />
Park City Municipal Corporation<br />
BLM<br />
United Park City Mines<br />
United Park City Mines<br />
Various Private Land Owners<br />
V. Technical Analysis<br />
(See Section 7.0 for details)<br />
Data are presented in Section 4.0 showing average concentrations and flows for bi-monthly<br />
periods at each “key” sampling location. Table 7 presents a summary <strong>of</strong> flows, concentrations<br />
and loads at key stations for each <strong>of</strong> these bi-monthly periods. Sections 9.0 and 10.0 provide the<br />
Best Management Practices (BMPs) that can be used to remedy the widespread nonpoint sources<br />
<strong>of</strong> metals in the <strong>Silver</strong> <strong>Creek</strong> <strong>Water</strong>shed. Literature values for the effectiveness <strong>of</strong> each BMP are<br />
provided in Table 14. Utilizing the removal efficiencies for each BMP, reductions in zinc and<br />
cadmium loading values are calculated along with anticipated stream concentrations after BMP<br />
implementation. Completion <strong>of</strong> scheduled BMPs is expected to achieve and maintain the TMDL<br />
endpoints for <strong>Silver</strong> <strong>Creek</strong>.<br />
VI. Margin <strong>of</strong> Safety & Seasonality<br />
(See Sections 4.0 & 5.0)<br />
There is significant variability in the existing flow and chemical data set for this TMDL which<br />
lends uncertainty to the loading analysis. Additionally, there is uncertainty in the actual degree<br />
<strong>of</strong> success that implementation <strong>of</strong> the BMPs identified to address nonpoint sources will achieve.<br />
Accordingly, the Margin <strong>of</strong> Safety to address these sources <strong>of</strong> uncertainty for this TMDL will<br />
include the following components:<br />
• An explicit margin <strong>of</strong> safety <strong>of</strong> 25% is utilized in the allocation calculations for the<br />
<strong>Silver</strong> <strong>Creek</strong> TMDL<br />
• Ongoing Monitoring Program will be implemented<br />
• Use <strong>of</strong> the maximum hardness <strong>of</strong> 400 mg/l in calculating the hardness adjusted <strong>Water</strong><br />
<strong>Quality</strong> Standards that are used as the endpoint for this TMDL (use <strong>of</strong> actual hardness<br />
would have resulted in higher values for the <strong>Water</strong> <strong>Quality</strong> Standards)<br />
Page 4
<strong>Silver</strong> <strong>Creek</strong> <strong>Water</strong>shed TMDL Final Report<br />
Seasonal analysis <strong>of</strong> the data is described in section 4.0. Statistical analysis determined that<br />
bimonthly partitioning <strong>of</strong> the data best reflects the seasonal nature <strong>of</strong> the data.<br />
VII. TMDL<br />
(See Section 8.0 for details)<br />
Table 12 provides the zinc and cadmium allocations for each key monitoring station in the <strong>Silver</strong><br />
<strong>Creek</strong> <strong>Water</strong>shed. The reduction needed for each <strong>of</strong> the key stations varies from 48% to 86% for<br />
zinc and 31% to 92% for cadmium.<br />
VIII. Allocation<br />
(See Section 8.0 for details)<br />
Section 8.0 and Table 12 include the allocation for zinc and cadmium between non-point<br />
sources, the one point source in the watershed and the margin <strong>of</strong> safety.<br />
Waste Load Allocation calculations are included in Section 8.0 for the <strong>Silver</strong> <strong>Creek</strong> <strong>Water</strong><br />
Reclamation Facility. Effluent limits for zinc (0.30 mg/l) and cadmium (0.0008 mg/l) are<br />
proposed to assure that the hardness adjusted chronic water quality standards used as endpoints<br />
for this TMDL are met in the stream after mixing with wastewater effluent. These effluent limits<br />
will not be required until significant progress is made on the non-point source pollution problems<br />
in the <strong>Silver</strong> <strong>Creek</strong> <strong>Water</strong>shed.<br />
IX. Public Participation<br />
(See Section 12.0 for details)<br />
Section 12.0 provides the description <strong>of</strong> the rather extensive public involvement and<br />
participation for this TMDL. The Upper <strong>Silver</strong> <strong>Creek</strong> <strong>Water</strong>shed Stakeholders Group has held<br />
regular meetings since March 20, 2001. Several public meetings have been held to allow for<br />
public input and comment on this TMDL. A formal 30 day comment period was also provided<br />
for public comment on the draft TMDL.<br />
Page 5
<strong>Silver</strong> <strong>Creek</strong> <strong>Water</strong>shed TMDL Final Report<br />
Acronyms List<br />
ac<br />
AFY<br />
BLM<br />
BMPs<br />
CaCO 3<br />
Cd<br />
CF<br />
cfs<br />
CV<br />
DEQ<br />
DWQ<br />
EE/CA<br />
HUC<br />
in<br />
LA<br />
lb<br />
lb/day<br />
lb/mi<br />
mg/l<br />
MOS<br />
NPS<br />
PIP<br />
RAO<br />
STORET<br />
TMDL<br />
UPCM<br />
UPDES<br />
USEPA<br />
USGS<br />
WLA<br />
WRF<br />
Zn<br />
Acre<br />
Acre-feet per year<br />
Bureau <strong>of</strong> Land Management<br />
Best Management Practices<br />
Calcium Carbonate<br />
Cadmium<br />
Conversion Factor<br />
Cubic Feet per Second<br />
Coefficient <strong>of</strong> Variation<br />
Department <strong>of</strong> Environmental <strong>Quality</strong><br />
<strong>Division</strong> <strong>of</strong> <strong>Water</strong> <strong>Quality</strong><br />
Engineering Evaluation/Cost Analysis<br />
Hydrologic Accounting Unit<br />
Inches<br />
Load Allocation<br />
Pounds<br />
Pounds per Day<br />
Pounds per Mile<br />
milligrams per liter<br />
Margin <strong>of</strong> Safety<br />
Non-Point Source<br />
Project Implementation Plan<br />
Response Action Objective<br />
STOrage and RETrieval (water quality, biological, physical data)<br />
Total Maximum Daily Load<br />
United Park City Mines<br />
<strong>Utah</strong> Pollution Discharge Elimination System<br />
United States Environmental Protection Agency<br />
United States Geological Survey<br />
Waste Load Allocation<br />
<strong>Water</strong> Reclamation Facility<br />
Zinc<br />
Page 6
<strong>Silver</strong> <strong>Creek</strong> <strong>Water</strong>shed TMDL Final Report<br />
1.0 INTRODUCTION<br />
1.1 <strong>Water</strong>shed Description<br />
<strong>Silver</strong> <strong>Creek</strong> is a smaller tributary <strong>of</strong> the Weber River. The Weber River originates in Summit<br />
County near Reids Peak (11,708 ft) in the western end <strong>of</strong> the Uinta Mountain range and flows<br />
approximately 125 miles generally to the Northwest to the Great Salt Lake at approximately<br />
4200 ft. elevation. Much <strong>of</strong> the watershed is included in the rugged Uinta and Wasatch<br />
Mountain ranges. The Ogden River, the major tributary to the Weber River, lies within Weber<br />
County and enters the Weber River approximately 12 miles upstream from its mouth. The other<br />
major tributaries to the Weber River are East Canyon <strong>Creek</strong>, Lost <strong>Creek</strong>, Chalk <strong>Creek</strong>, and<br />
Beaver <strong>Creek</strong>. Two smaller tributaries that can affect the water quality <strong>of</strong> the Weber River are<br />
Echo <strong>Creek</strong> and <strong>Silver</strong> <strong>Creek</strong>.<br />
The Geology <strong>of</strong> the <strong>Water</strong>shed is complex and composed principally <strong>of</strong> sedimentary deposits.<br />
Mountainous portions <strong>of</strong> the watershed are comprised <strong>of</strong> more faulted and fractured rocks while<br />
lower portions <strong>of</strong> the drainage basin closer to the Great Salt Lake are alluvial and<br />
lacustrine deposits.<br />
The <strong>Silver</strong> <strong>Creek</strong> watershed boundaries are defined by the USGS Hydrologic Accounting Unit<br />
(HUC) #16020101 and <strong>Utah</strong> <strong>Water</strong>body ID # UT16020101-020 (see Figure 1). The <strong>Silver</strong> <strong>Creek</strong><br />
watershed is located entirely within Summit County.<br />
Climate<br />
Due to substantial differences in elevation within the watershed, precipitation patterns are<br />
markedly different throughout the watershed. Average annual precipitation ranges from 15 to 30<br />
inches with the highest mountainous areas receiving the highest precipitation totals. As is the<br />
case with many western watersheds, annual precipitation totals vary dramatically. Snow<br />
accumulation and melt is a very significant feature in terms <strong>of</strong> the annual hydrologic cycle for<br />
this watershed.<br />
Average maximum temperatures are in the mid eighties (highest in July) and average minimum<br />
temperatures are in the low teens (lowest in January).<br />
Land Use<br />
Land uses are quite varied throughout the watershed. High mountain areas are used for a variety<br />
<strong>of</strong> recreational and grazing purposes. There are several ski resorts and golf courses, as well as<br />
numerous agricultural land uses. Portions <strong>of</strong> the watershed are undergoing extensive growth<br />
from residential and commercial development. The agricultural uses are declining as the basin<br />
develops and becomes more urbanized.<br />
Demographics<br />
The population <strong>of</strong> Summit County was 32,236 in 2002. The county’s average annual rate <strong>of</strong><br />
growth from 1990 to 2000 was 6.7%, the fastest rate <strong>of</strong> any county in <strong>Utah</strong>. Park City is the<br />
Page 7
<strong>Silver</strong> <strong>Creek</strong> <strong>Water</strong>shed TMDL Final Report<br />
largest city in the county with a population <strong>of</strong> 7,371 (Census 2000). Median age is 33.3 years,<br />
average household size is 2.87 people per household, per capita income (the highest in the state<br />
<strong>Silver</strong> <strong>Creek</strong> <strong>Water</strong>shed<br />
River<br />
Weber<br />
<strong>Silver</strong> <strong>Creek</strong> <strong>Water</strong>shed<br />
$T Fish Tissue Sample<br />
(492XXX)<br />
#S STORETS<br />
Major Roads<br />
Interstate<br />
U.S. Highway<br />
N<br />
Wanship #S<br />
LSC-3<br />
$T<br />
.-, 80<br />
675<br />
State Route<br />
ôó 32<br />
Perennial Streams<br />
#S 701<br />
LSC-2<br />
Reservoirs<br />
$T<br />
Park City Boundary<br />
1 0 1 2 3 Miles<br />
.-, 80 $T<br />
LSC-5<br />
East<br />
Canyon<br />
<strong>Creek</strong><br />
#S<br />
679<br />
#S 674<br />
$T LSC-4<br />
LSC-1<br />
$T<br />
#S<br />
680<br />
<strong>Silver</strong><br />
<strong>Creek</strong><br />
Rockport<br />
Reservoir<br />
#S<br />
Kimbal<br />
<strong>Silver</strong> <strong>Creek</strong><br />
l<br />
Cree k<br />
(/ 40<br />
ø÷ 224 ø÷ 248<br />
Park<br />
USC-3<br />
USC-2<br />
$T<br />
685<br />
#S<br />
$T<br />
Richardson Flat<br />
USC-1<br />
$T #S<br />
695<br />
City<br />
ø÷ 248<br />
Jordanelle<br />
Reservoir<br />
silver creek.apr<br />
Figure 1: <strong>Silver</strong> <strong>Creek</strong> <strong>Water</strong>shed TMDL Study Area<br />
Page 8
<strong>Silver</strong> <strong>Creek</strong> <strong>Water</strong>shed TMDL Final Report<br />
<strong>of</strong> <strong>Utah</strong>) in 2001 was $42,102, unemployment rate in 2001 was 8.8%. Services and trade sectors<br />
accounted for nearly 56% <strong>of</strong> the county’s nonagricultural employment – a figure consistent with<br />
the county’s high specialization in tourism-related industries.<br />
1.2 <strong>Water</strong> Budget<br />
Hydrologic data are extremely limited and inconsistent within the <strong>Silver</strong> <strong>Creek</strong> watershed. These<br />
inadequacies make the preparation <strong>of</strong> a detailed water budget for the basin very difficult. As a<br />
result, this section presents the data that are available, and recognizes the need for additional<br />
monitoring <strong>of</strong> the watershed to better understand flows in streams, irrigation canals, and<br />
groundwater.<br />
Weather Data<br />
There are three weather stations in the vicinity <strong>of</strong> the <strong>Silver</strong> <strong>Creek</strong> watershed; located at Park<br />
City, Wanship Dam, and <strong>Silver</strong> Lake Brighton. Figure 2 shows the location <strong>of</strong> these stations.<br />
Figure 2: Weather Stations<br />
Page 9
<strong>Silver</strong> <strong>Creek</strong> <strong>Water</strong>shed TMDL Final Report<br />
Data for Normal Precipitation and Normal Potential Evapotranspiration were obtained for these<br />
three stations. Table 1 shows the area <strong>of</strong> influence for each <strong>of</strong> the weather stations, based on<br />
linear partitioning.<br />
Table 1: Weather Station Areas <strong>of</strong> Influence<br />
Station Area (ac)<br />
Percent <strong>of</strong><br />
<strong>Water</strong>shed<br />
Brighton 100 0.3%<br />
Park City 13,778 45.4%<br />
Wanship 16,443 54.2%<br />
Total 30,321 100 %<br />
Using these areas, monthly composite values for Normal Precipitation and Normal Potential<br />
Evapotranspiration were calculated. These values are shown in Table 2.<br />
Table 2: Composite <strong>Water</strong>shed Weather Data<br />
Jan Feb Mar Apr May Jun Jul<br />
Total<br />
Aug Sep Oct Nov Dec (in)<br />
Total<br />
(AFY)<br />
Total Precip (in) 1.56 1.25 1.52 1.63 1.63 1.13 1.66 1.33 1.91 1.45 1.78 1.71 18.55 47,000<br />
Potential ET (in) 0.76 1.13 2.07 3.53 5.23 6.59 7.56 6.57 4.43 2.68 1.15 0.71 42.41 107,000<br />
It is noteworthy to mention the relatively high value <strong>of</strong> Normal Annual Potential<br />
Evapotranspiration (shown in acre-feet per year), which is more than two times the Normal<br />
Annual Precipitation in the watershed. While this value does not represent true evaporation, it<br />
does reflect the dry climate <strong>of</strong> the watershed and the high potential for evaporation losses.<br />
Flow Data<br />
Flow data for each <strong>of</strong> the STORET sampling locations were typically recorded as water quality<br />
samples were taken. A hydrologic pr<strong>of</strong>ile showing how average annual flow increases from the<br />
top <strong>of</strong> the watershed to the outlet is shown in Figure 3.<br />
Figure 4 shows seasonal trends in flow for each <strong>of</strong> the key stations for each bimonthly period.<br />
Peak flows occur at Wanship in the second bimonthly period (March to April), while the other<br />
locations have their peak flow during the third bimonthly period (May to June).<br />
The key stations included in the flow analysis and water quality analysis are listed in Table 3.<br />
Table 3: Key Stations<br />
Key Station Description<br />
Park City 492695<br />
Richardson Flat 492685<br />
Above Atkinson 492680<br />
<strong>Silver</strong> <strong>Creek</strong> WRF 492679<br />
Atkinson 492674<br />
STORET Number<br />
Page 10
<strong>Silver</strong> <strong>Creek</strong> <strong>Water</strong>shed TMDL Final Report<br />
SILVER CREEK<br />
Hydrologic Pr<strong>of</strong>ile<br />
12.0<br />
STORET Data Only<br />
10.0<br />
Average Annual Flow - cfs<br />
8.0<br />
6.0<br />
4.0<br />
Ab Atkinson + WWTP<br />
Atkinson<br />
Wanship<br />
Richardson Flat<br />
2.0<br />
Park City<br />
0.0<br />
Figure 3: <strong>Silver</strong> <strong>Creek</strong> Hydrologic Pr<strong>of</strong>ile<br />
25<br />
20<br />
Average Flow - cfs<br />
15<br />
10<br />
Park City<br />
Richardson Flat<br />
Ab Atkinson + WWTP<br />
Atkinson<br />
Wanship<br />
5<br />
0<br />
0 Jan-Feb 1 Mar-Apr 2 May-Jun 3 Jul-Aug 4 Sep-Oct 5 Nov-Dec 6<br />
Bimonthly Period<br />
7<br />
Figure 4: <strong>Silver</strong> <strong>Creek</strong> Annual Flow Patterns<br />
Page 11
<strong>Silver</strong> <strong>Creek</strong> <strong>Water</strong>shed TMDL Final Report<br />
<strong>Water</strong>shed Outlet<br />
Flows at the Wanship sampling location (above the confluence with the Weber River) average 10<br />
cfs. This corresponds to an average <strong>of</strong> approximately 7,000 acre-feet per year (AFY) leaving the<br />
watershed and entering the Weber River. Outflow from the watershed is approximately seven<br />
times less than the total amount <strong>of</strong> water coming into the watershed through precipitation,<br />
suggesting that the majority <strong>of</strong> the water exiting the system does so through mechanisms such as<br />
evapotranspiration, groundwater recharge etc.<br />
Remaining Uncertainties<br />
The following items remain unknown in this hydrologic system:<br />
• Contribution <strong>of</strong> groundwater (inflow or outflow) to various stream reaches and/or transbasin<br />
flow<br />
• <strong>Water</strong>shed evaporation<br />
• Locations and flows <strong>of</strong> irrigation diversions<br />
• Effective precipitation<br />
1.3 <strong>Water</strong> <strong>Quality</strong> Impairment<br />
The <strong>Silver</strong> <strong>Creek</strong> from the confluence with the Weber River to its headwaters is listed on <strong>Utah</strong>’s<br />
1998, 2000, and 2002 303(d) list <strong>of</strong> impaired water bodies. This waterbody is included in the<br />
“high priority” group on <strong>Utah</strong>’s 303(d) list indicating a Total Maximum Daily Load (TMDL)<br />
should be completed at this time.<br />
<strong>Water</strong> quality concerns in the <strong>Silver</strong> <strong>Creek</strong> <strong>Water</strong>shed are focused on two metals; zinc and<br />
cadmium. All indications suggest that the metals <strong>of</strong> concern in this watershed are from historical<br />
mining activities in the Park City area. Elevated concentrations <strong>of</strong> zinc and cadmium were the<br />
cause for <strong>Silver</strong> <strong>Creek</strong> being assessed as not fully supporting its Class 3A beneficial use.<br />
1.4 Effects <strong>of</strong> Zinc and Cadmium<br />
Zinc<br />
Zinc is one <strong>of</strong> the most commonly used metals in the world. Its major uses are for galvanizing<br />
steel, producing alloys, and for serving as an ingredient in rubber, ceramics, and paints. Toxic<br />
concentrations <strong>of</strong> zinc compounds cause adverse changes in the morphology and physiology <strong>of</strong><br />
fish. Acutely toxic concentrations may induce cellular breakdown <strong>of</strong> the gills and clogging <strong>of</strong> the<br />
gills with mucous. Chronically toxic concentrations <strong>of</strong> zinc compounds cause general<br />
enfeeblement and widespread histological changes to many organs. Growth and maturation are<br />
also retarded. (U.S. EPA, 1980). Some fish accumulate zinc in their bodies if they live in water<br />
containing zinc.<br />
Increased zinc concentrations will also adversely impact macroinvertebrate populations in a<br />
stream. Macroinvertebrates, which are a necessary component <strong>of</strong> the fish food chain, have been<br />
shown to exhibit adverse impacts at zinc concentrations similar to those concentrations at which<br />
fish begin to exhibit adverse impacts. (U.S. EPA, 1980). In humans, ingestion <strong>of</strong> large amounts<br />
<strong>of</strong> zinc, can cause stomach cramps, nausea, and vomiting. Zinc can also can cause anemia,<br />
Page 12
<strong>Silver</strong> <strong>Creek</strong> <strong>Water</strong>shed TMDL Final Report<br />
pancreas damage, and lower levels <strong>of</strong> high-density lipoprotein cholesterol—the good form <strong>of</strong><br />
cholesterol.<br />
Cadmium<br />
Cadmium is a highly toxic heavy metal with the ability to easily form complexes with other<br />
metals and elements. Cadmium is widely used in industry for metal coating, pigments and paints,<br />
batteries, in solder alloys, etc. The internalization <strong>of</strong> cadmium into an animal's physiological<br />
system can cause serious damage to tissue and organs. In vertebrates, cadmium accumulates in<br />
the liver and kidneys. There is strong evidence for bioaccumulation but the potential for<br />
biomagnification is uncertain.<br />
Cadmium is a minor nutrient for plants at low concentrations but is toxic to fish and other<br />
aquatic life at concentrations slightly higher. Cadmium causes behavior, growth, and<br />
physiological problems in aquatic life at sublethal concentrations. Cadmium has been shown to<br />
have an undesirable toxic effect on humans and animals at low concentrations and is injurious to<br />
plant life. Effects on humans are to cause cramps, nausea, vomiting and diarrhea. Cadmium tends<br />
to concentrate in the liver, kidneys, pancreas and thyroid <strong>of</strong> humans.<br />
Page 13
<strong>Silver</strong> <strong>Creek</strong> <strong>Water</strong>shed TMDL Final Report<br />
2.0 WATER QUALITY STANDARDS<br />
The <strong>Silver</strong> <strong>Creek</strong> watershed is listed on the State <strong>of</strong> <strong>Utah</strong>’s 303(d) list as impaired for zinc and<br />
cadmium. Beneficial use 3A, protected for cold-water fish and other cold-water species, is<br />
identified as impaired. <strong>Water</strong> quality data and analysis are discussed in Sections 3 and 4. Data<br />
for the following constituents were gathered to quantify and evaluate this impairment:<br />
• Total and Dissolved Cadmium<br />
• Total and Dissolved Zinc<br />
• Total Dissolved Solids<br />
• Total Suspended Solids<br />
• pH<br />
Data for total dissolved solids and total suspended solids were gathered because metals such as<br />
zinc and cadmium are <strong>of</strong>ten present within these solids. Values for all <strong>of</strong> these constituents are<br />
sufficient to provide a good understanding <strong>of</strong> existing water quality impairments present in this<br />
area. Data for the constituents were gathered from the <strong>Utah</strong> <strong>Division</strong> <strong>of</strong> <strong>Water</strong> <strong>Quality</strong> (DWQ)<br />
and from the Environmental Protection Agency (EPA). Data beginning in January 1990 through<br />
2002 were obtained for monitoring stations located on or near <strong>Silver</strong> <strong>Creek</strong>.<br />
2.1 <strong>Water</strong> <strong>Quality</strong> Targets and Endpoints<br />
<strong>Water</strong> quality standards for zinc and cadmium were obtained from the State <strong>of</strong> <strong>Utah</strong>, Rule R317-<br />
2-14. This rule states that the standards for zinc and cadmium are dependent on the hardness <strong>of</strong><br />
the water. Hardness is used as a surrogate for a number <strong>of</strong> water quality characteristics which<br />
affect the toxicity <strong>of</strong> metals. Increasing hardness has the effect <strong>of</strong> decreasing the toxicity <strong>of</strong><br />
metals. <strong>Water</strong> quality criteria to protect aquatic life may be calculated at different concentrations<br />
<strong>of</strong> hardness measured in milligrams per liter (mg/l) as calcium carbonate (CaCO 3 ). (EPA,<br />
National Recommended <strong>Water</strong> <strong>Quality</strong> Criteria 2002, www.epa.<strong>gov</strong>/waterscience/pc/revcom.pdf.)<br />
Table 4 shows the equations provided by the State <strong>of</strong> <strong>Utah</strong> to calculate these standards.<br />
Table 4: <strong>Water</strong> <strong>Quality</strong> Standard Calculations<br />
Chronic<br />
Zinc e (0.8473(ln(hardness))+0.884)<br />
Cadmium e (0.7409(ln(hardness))-4.719)<br />
The average hardness measured in the <strong>Silver</strong> <strong>Creek</strong> watershed was found to be 484 mg/l. The<br />
equations shown in Table 4 that were used to calculate hardness adjusted water quality standards<br />
for zinc and cadmium are only considered valid up to a hardness <strong>of</strong> 400 mg/l. The use <strong>of</strong> a<br />
maximum hardness <strong>of</strong> 400 mg/l for calculating hardness adjusted water quality standards for<br />
metals is in accordance with <strong>Utah</strong>’s <strong>Water</strong> <strong>Quality</strong> Standards R317-2-14. <strong>Utah</strong>’s use <strong>of</strong> a<br />
maximum hardness <strong>of</strong> 400 was specifically recommended by Region 8 EPA in a letter to the<br />
<strong>Division</strong> dated Dec. 20, 2001. The National Recommended <strong>Water</strong> <strong>Quality</strong> Criteria: 2002 (EPA<br />
822-R-02-047 Nov. 2002) also specifically address this issue. At high hardness values such as<br />
Page 14
<strong>Silver</strong> <strong>Creek</strong> <strong>Water</strong>shed TMDL Final Report<br />
those in <strong>Silver</strong> <strong>Creek</strong>, there is concern that the hardness and related inorganic water quality<br />
characteristics do not correlate as well as when hardness values are below 400. Limited data are<br />
available to quantify the relationship between hardness and toxicity. Therefore, a hardness <strong>of</strong> 400<br />
mg/l was used for the purpose <strong>of</strong> establishing the water quality standards for zinc and cadmium<br />
with the exception <strong>of</strong> where seasonal hardness values dropped below 400 mg/l (see section 4.3).<br />
Because the calculated water quality standard increases as hardness increases, using this lower<br />
value for hardness results in a more conservative (stricter) standard. Table 5 shows the resulting<br />
water quality endpoints that were used in this analysis.<br />
Table 5: <strong>Water</strong> <strong>Quality</strong> Endpoints For <strong>Silver</strong> <strong>Creek</strong><br />
Constituent<br />
Chronic<br />
(mg/l)<br />
Zinc<br />
Cadmium<br />
0.39<br />
0.0008<br />
*Based on hardness <strong>of</strong> 400 mg/l CaCO 3<br />
The chronic <strong>Water</strong> <strong>Quality</strong> Standard is used in the <strong>Silver</strong> <strong>Creek</strong> TMDL based on <strong>Utah</strong>’s recent<br />
adoption <strong>of</strong> chronic criteria for listing waters in the 303(d) process (March 27, 2003 letter from<br />
Don Ostler, to Bruce Zander, EPA Region 8).<br />
Page 15
<strong>Silver</strong> <strong>Creek</strong> <strong>Water</strong>shed TMDL Final Report<br />
Figure 5: <strong>Silver</strong> <strong>Creek</strong> Hydrology Map<br />
Page 16
3.0 WATER QUALITY DATA<br />
3.1 Sources <strong>of</strong> Data<br />
<strong>Silver</strong> <strong>Creek</strong> <strong>Water</strong>shed TMDL Final Report<br />
In order to assess the quality <strong>of</strong> the water in <strong>Silver</strong> <strong>Creek</strong> and to quantify the impairment <strong>of</strong> the<br />
stream with respect to zinc and cadmium, several sources <strong>of</strong> data were considered. These data<br />
sources were collected by different <strong>gov</strong>ernment agencies and are summarized below and in<br />
Appendix A <strong>of</strong> this report.<br />
STORET<br />
STOrage and RETrieval (STORET) is a repository for water quality, biological, and physical<br />
data, and it is used by state environmental agencies, EPA and other Federal agencies,<br />
universities, private citizens, and many others. This data was collected by the <strong>Utah</strong> <strong>Division</strong> <strong>of</strong><br />
<strong>Water</strong> <strong>Quality</strong> over a twelve-year period between 1990 and 2002, and covers the reach <strong>of</strong> <strong>Silver</strong><br />
<strong>Creek</strong> from the Weber River at Wanship upstream to a station located near Bonanza Drive in<br />
Park City (see Figure 5). Not all <strong>of</strong> the sampling stations were sampled consistently throughout<br />
this period.<br />
USGS<br />
USGS conducted two separate studies on <strong>Silver</strong> <strong>Creek</strong>, one in 2000 and another in 2002. The<br />
USGS sampling locations cover the same reach <strong>of</strong> the stream as do the STORET stations.<br />
USEPA<br />
In the Year 2000, USEPA sampled during the Spring, Summer, and Autumn periods in the reach<br />
<strong>of</strong> the stream from the vicinity <strong>of</strong> Richardson Flats upstream to the headwaters <strong>of</strong> <strong>Silver</strong> <strong>Creek</strong>.<br />
3.2 Data Limitations<br />
As with most studies <strong>of</strong> this nature, there has not been continuous sampling conducted<br />
throughout the watershed over the 13 year time period analyzed. The sampling has included<br />
different time spans, non-uniform sampling within the time spans, and inconsistent flow<br />
measurements. Sometimes flow measurements were made concurrently with water quality<br />
sampling, and at other times no flow measurements were made. There do not appear to be any<br />
data points where only flow measurements were made.<br />
Figure 6 shows the sampling performed for dissolved zinc at the STORET locations. Only two<br />
sampling locations have data for the entire time span <strong>of</strong> the study. Most locations have data<br />
limited to shorter time periods.<br />
Generally there are small populations <strong>of</strong> data for most time periods. This necessitated the<br />
clustering <strong>of</strong> the individual data points. The purpose <strong>of</strong> the clustering was to be able to compute<br />
statistically reliable parameters for each time interval within the year. Because the standard error<br />
<strong>of</strong> estimate <strong>of</strong> the mean value for populations is approximately proportional to the inverse <strong>of</strong> the<br />
square root <strong>of</strong> the number <strong>of</strong> data points, it is important to have a minimum number <strong>of</strong> data<br />
points in order to reasonably estimate the mean value for the population. Therefore, the time<br />
interval for clustering was expanded until such time as the minimum number <strong>of</strong> data points per<br />
interval was in the range <strong>of</strong> 4 to 5. In order to accomplish this objective, it was necessary to<br />
Page 17
<strong>Silver</strong> <strong>Creek</strong> <strong>Water</strong>shed TMDL Final Report<br />
cluster the data into two-month intervals. That is to say, the data within each two-month period<br />
was considered to be <strong>of</strong> the same population. Therefore, for characterizing <strong>Silver</strong> <strong>Creek</strong> water<br />
quality, both water quality data and flow data were clustered into six two-month intervals for the<br />
purpose <strong>of</strong> calculating mean values, and from these values determining annual patterns.<br />
8.0<br />
7.0<br />
6.0<br />
Park City (492695)<br />
Richardson (492685)<br />
Above Atkinson (492680)<br />
Atkinson (492674)<br />
Wanship (492675)<br />
Chronic Zn Standard (0.39)<br />
Zinc Concentration (mg/l)<br />
5.0<br />
4.0<br />
3.0<br />
2.0<br />
1.0<br />
0.0<br />
1990 1991 1992 1993 1994 1995 1996 1997 1998 1999 2000 2001 2002 2003<br />
Figure 6: STORET Zinc Data Scatter Plot<br />
Because <strong>of</strong> the inconsistency <strong>of</strong> flow and water quality sampling data, flow and concentration<br />
data were separated. Independent estimates <strong>of</strong> means for each data set were then calculated.<br />
Estimates <strong>of</strong> loadings were then calculated using the mean values for flow and concentration for<br />
each bi-monthly cluster.<br />
The analysis completed for the TMDL utilized only dissolved values for analysis. There were<br />
only 7 instances where total zinc and cadmium values were available.<br />
3.3 Key Sampling Locations<br />
Because <strong>of</strong> the longer time period embodied in the STORET data (13 years), the focus was on<br />
this data set. This data set was used for the principal analysis in this study. The USGS and<br />
USEPA data were overlaid and used for verification. There are nine STORET stations on <strong>Silver</strong><br />
<strong>Creek</strong> in the reach between Park City and the confluence with the Weber River. There are no<br />
STORET stations above Park City. Of these nine STORET locations, five are selected as “key”.<br />
In addition to these, the <strong>Silver</strong> <strong>Creek</strong> <strong>Water</strong> Reclamation Facility was included, because <strong>of</strong> it’s<br />
potential as being a source <strong>of</strong> pollutant loadings. Table 6 shows these stations, their period <strong>of</strong><br />
record, and the reasons why some were not used.<br />
Page 18
<strong>Silver</strong> <strong>Creek</strong> <strong>Water</strong>shed TMDL Final Report<br />
Table 6: Key STORET Locations<br />
Key Period <strong>of</strong><br />
STORET<br />
Description<br />
Comments<br />
Station Record<br />
492674 <strong>Silver</strong> <strong>Creek</strong> In Atkinson Yes 1996-2002<br />
492675 <strong>Silver</strong> <strong>Creek</strong> In Wanship Ab. Weber R. Yes 1992-2002<br />
492676 <strong>Silver</strong> <strong>Creek</strong> 2 Miles North <strong>of</strong> Atkinson No Prior to 1990 Not Sampled 1990-2002<br />
492677 <strong>Silver</strong> Ck at I-80 No Prior to 1990 Not Sampled 1990-2002<br />
492679 <strong>Silver</strong> <strong>Creek</strong> WWTP No 1998-2002 Not on <strong>Silver</strong> <strong>Creek</strong><br />
492680 <strong>Silver</strong> <strong>Creek</strong> Ab. Atkinson Yes 1998-2002<br />
492685 <strong>Silver</strong> <strong>Creek</strong> Below Richardson Flats Yes 1992-2002<br />
492695 <strong>Silver</strong> <strong>Creek</strong> Ab. Prospector Square Yes 1997-2002<br />
492697 Park Meadow Drain Ck. Ab. <strong>Silver</strong> <strong>Creek</strong> No 1998-1999 Not on <strong>Silver</strong> <strong>Creek</strong><br />
The USGS and USEPA sampling stations used for this report are summarized in Table 7. The<br />
original study station designations as well as nearby STORET locations (in parentheses in each<br />
header) are presented.<br />
Table 7: USGS, EPA Sampling Locations and Corresponding STORET Sites<br />
Above Atkinson ( 492680)<br />
USGS 2002 SCS-6000 <strong>Silver</strong> <strong>Creek</strong> Above <strong>Silver</strong> <strong>Creek</strong> WWTP<br />
Atkinson (492674)<br />
USGS 2000 <strong>Silver</strong> <strong>Creek</strong> At Atkinson<br />
USGS 2002 SCS-6500 <strong>Silver</strong> <strong>Creek</strong> At Atkinson (Below WWTP)<br />
Park City (492695)<br />
USEPA 2000 USC-8, State Sample Site<br />
USGS 2000 <strong>Silver</strong> <strong>Creek</strong> At Bonanza Dr.<br />
Richardson (492685)<br />
USEPA 2000 USC-1, Rail Tressel @ U248<br />
USEPA 2000 USC-2, Culvert @ U248<br />
USEPA 2000 USC-3, Upstream RR Tressel<br />
USGS 2000 <strong>Silver</strong> <strong>Creek</strong> Above Richardson Flats<br />
USGS 2002 SCS-5500 <strong>Silver</strong> <strong>Creek</strong> Below Richardson Flats - USGS 2002<br />
Wanship (492675)<br />
USGS 2000 <strong>Silver</strong> <strong>Creek</strong> At Wanship<br />
USGS 2002 SCS-7000 <strong>Silver</strong> <strong>Creek</strong> @ Wanship<br />
Page 19
4.0 DATA ANALYSIS RESULTS<br />
4.1 Zinc and Cadmium Standards<br />
<strong>Silver</strong> <strong>Creek</strong> <strong>Water</strong>shed TMDL Final Report<br />
<strong>Water</strong> quality standards for zinc and cadmium are discussed in Section 2.0. A review <strong>of</strong> the data<br />
shows 57% (131 <strong>of</strong> 230) <strong>of</strong> the zinc values included in the data set (Appendix A) exceed the<br />
hardness adjusted water quality standard <strong>of</strong> 0.39 mg/l. Similarly, 52% (117 <strong>of</strong> 226) <strong>of</strong> the<br />
cadmium values observed exceed the hardness adjusted water quality standard <strong>of</strong> 0.0008mg/l.<br />
4.2 <strong>Water</strong> <strong>Quality</strong> and Flow Results by Location<br />
This section presents average concentrations and flows for each <strong>of</strong> the "key" sampling locations<br />
during each <strong>of</strong> the six bi-monthly periods. A summary <strong>of</strong> findings is provided followed by three<br />
figures showing bi-monthly zinc concentrations, bi-monthly cadmium concentrations, and bimonthly<br />
flow.<br />
Park City<br />
Zinc concentrations are lowest during the fourth period (July, August) and the highest during the<br />
first period (January, February). <strong>Water</strong> quality standards for zinc are exceeded during the first<br />
half <strong>of</strong> the year. Concentrations reach 1.5 times the standard. Flows are relatively low, and are<br />
greatest during the second and third periods (March through June).<br />
Cadmium concentrations are lowest in the fourth and fifth periods (July through October) and<br />
highest in the second period (March through April). Concentrations exceed the chronic standard<br />
throughout the year.<br />
Zinc Concentration (mg/l)<br />
1.8<br />
1.6<br />
1.4<br />
1.2<br />
1.0<br />
0.8<br />
0.6<br />
0.4<br />
0.2<br />
Park City (492695)<br />
Bi-Monthly Zinc Concentrations<br />
STORET Average (1990-2002)<br />
Overall Average<br />
STORET (1990-2002)<br />
USGS (2000)<br />
EPA (2000)<br />
Chronic Zn Standard (0.39)<br />
0.0<br />
Jan - Feb Mar - Apr<br />
May - Jun<br />
Jul - Aug<br />
Sep-Oct<br />
Nov - Dec<br />
0 1 2 3 4 5 6 7<br />
Bi-Monthly Period<br />
Figure 7: Park City Bi-Monthly Zinc<br />
Page 20
<strong>Silver</strong> <strong>Creek</strong> <strong>Water</strong>shed TMDL Final Report<br />
Cadmium Concentration (mg/l)<br />
0.020<br />
0.018<br />
0.016<br />
0.014<br />
0.012<br />
0.010<br />
0.008<br />
0.006<br />
0.004<br />
0.002<br />
0.000<br />
Park City<br />
Bi-Monthly ( Cadmium ) Concentrations<br />
Jan - Feb Mar - Apr<br />
May - Jun Jul - Aug Sep-Oct<br />
Nov - Dec<br />
0 1 2 3 4 5 6 7<br />
Bi-Monthly Period<br />
STORET Average (1990-2002)<br />
Overall Average<br />
STORET (1990-2002)<br />
USGS (2000)<br />
EPA (2000)<br />
Chronic Cd Standard (0.0008)<br />
Figure 8: Park City Bi-Monthly Cadmium<br />
Park City (492695)<br />
Bi-Monthly Flow<br />
Flow (cfs)<br />
16<br />
14<br />
12<br />
10<br />
8<br />
6<br />
4<br />
2<br />
0<br />
STORET Average (1990-2002)<br />
Overall Average<br />
STORET Samples (1990-2002)<br />
EPA (2000)<br />
Jan - Feb Mar - Apr May - Jun Jul - Aug Sep-Oct Nov - Dec<br />
0 1 2 3 4 5 6 7<br />
Bi-Monthly Period<br />
Figure 9: Park City Bi-Monthly Flow<br />
Page 21
<strong>Silver</strong> <strong>Creek</strong> <strong>Water</strong>shed TMDL Final Report<br />
Richardson<br />
Zinc concentrations were found to be highest during the Winter and early Spring (Nov. through<br />
April) and lowest during the Summer and Fall months. On average, water quality standards for<br />
zinc are exceeded throughout the year, with concentrations reaching two times the standard.<br />
Flows peak in the third and fourth periods (from March to June).<br />
Cadmium concentrations are highest in the second period (March through April). Chronic water<br />
quality standards are typically exceeded most <strong>of</strong> the year.<br />
Zinc Concentration (mg/l)<br />
3.0<br />
2.5<br />
2.0<br />
1.5<br />
1.0<br />
0.5<br />
Richardson (492685)<br />
Bi-Monthly Zinc Concentrations<br />
STORET Average (1990-2002)<br />
Overall Average<br />
STORET Samples (1990-2002)<br />
USGS (2000)<br />
EPA (2000)<br />
USGS (2002)<br />
Chronic Zn Standard (0.39)<br />
0.0<br />
0 Jan 1 - Feb Mar 2- Apr<br />
May 3 - Jun<br />
Jul 4- Aug Sep-Oct 5 Nov 6 - Dec<br />
7<br />
Bi-Monthly Period<br />
Figure 10: Richardson Bi-Monthly Zinc<br />
Page 22
<strong>Silver</strong> <strong>Creek</strong> <strong>Water</strong>shed TMDL Final Report<br />
Richardson (492685)<br />
Bi-Monthly Cadmium Concentrations<br />
Cadmium Concentration (mg/l)<br />
0.020<br />
0.018<br />
0.016<br />
0.014<br />
0.012<br />
0.010<br />
0.008<br />
0.006<br />
0.004<br />
STORET Average(1990-2002)<br />
Overall Average<br />
STORET (1990-2002)<br />
USGS (2000)<br />
EPA (2000)<br />
Chronic Cd Standard (0.0008)<br />
0.002<br />
0.000<br />
0 Jan - 1 Feb Mar - 2Apr<br />
May 3- Jun<br />
Jul 4- Aug<br />
Sep-Oct 5 Nov 6 - Dec 7<br />
Bi-Monthly Period<br />
Figure 11: Richardson Bi-Monthly Cadmium<br />
25<br />
20<br />
Richardson (492685)<br />
Bi-Monthly Flow<br />
STORET Average (1990-2002)<br />
Overall Average<br />
STORET Samples (1990-2002)<br />
EPA (2000)<br />
USGS (2002)<br />
Flow (cfs)<br />
15<br />
10<br />
5<br />
0<br />
0 Jan 1 - Feb Mar - 2Apr<br />
May 3- Jun<br />
Jul 4- Aug Sep-Oct 5 Nov - 6 Dec 7<br />
Bi-Monthly Period<br />
Figure 12: Richardson Bi-Monthly Flow<br />
Page 23
<strong>Silver</strong> <strong>Creek</strong> <strong>Water</strong>shed TMDL Final Report<br />
Above Atkinson<br />
Zinc concentrations are highest during the Winter months (Nov. through Feb.) and lowest during<br />
late Summer and Fall (Sept. through Oct.). <strong>Water</strong> quality standards for zinc are exceeded for<br />
most <strong>of</strong> the year. Zinc concentrations reach up to six times the chronic standard. Flow fluctuates<br />
during the year with the highest flows during late Winter and early Summer. During the<br />
irrigation season, a significant flow is typically diverted into the Pace Family Irrigation<br />
Diversion. This diversion takes water from <strong>Silver</strong> <strong>Creek</strong> just below Richardson Flat and returns<br />
between the Atkinson and Above Atkinson water quality sampling stations.<br />
Cadmium concentrations are the highest during the Winter months (November through<br />
February). Late Summer and early Autumn months (July through October) have never had<br />
values above the detection limit. Chronic water quality standards are typically exceeded during<br />
the rest <strong>of</strong> the year.<br />
Above Atkinson (492680)<br />
Bi-Monthly Zinc Concentrations<br />
Zinc Concentration (mg/l)<br />
8.0<br />
7.0<br />
6.0<br />
5.0<br />
4.0<br />
3.0<br />
2.0<br />
STORET Average (1990-2002)<br />
Overall Average<br />
STORET Samples (1990-2002)<br />
USGS (2002)<br />
Chronic Zn Standard (0.39)<br />
1.0<br />
0.0<br />
0 Jan 1 - Feb Mar - Apr<br />
2 May 3- Jun<br />
Jul - Aug<br />
Sep-Oct Nov - Dec<br />
4 5 6 7<br />
Bi-Monthly Period<br />
Figure 13: Above Atkinson Bi-Monthly Zinc<br />
Page 24
<strong>Silver</strong> <strong>Creek</strong> <strong>Water</strong>shed TMDL Final Report<br />
Above Atkinson (492680)<br />
Bi-Monthly Cadmium Concentrations<br />
Cadmium Concentration (mg/l)<br />
0.025<br />
0.020<br />
0.015<br />
0.010<br />
0.005<br />
STORET Average (1990-2002)<br />
Overall Average<br />
STORET (1990-2002)<br />
Chronic Cd Standard (0.0008)<br />
0.000<br />
0 Jan - 1 Feb Mar - Apr 2 May - 3Jun<br />
Jul - Nov - Dec<br />
4Aug<br />
Sep-Oct 5 6 7<br />
Bi-Monthly Period<br />
Figure 14: Above Atkinson Bi-Monthly Cadmium<br />
Above Atkinson (492680)<br />
Bi-Monthly Flow<br />
12<br />
10<br />
8<br />
STORET Average (1990-2002)<br />
Overall Average<br />
STORET Samples (1990-2002)<br />
USGS (2002)<br />
Flow (cfs)<br />
6<br />
4<br />
2<br />
0<br />
0 Jan 1- Feb Mar - 2Apr<br />
May 3- Jun<br />
Jul 4- Aug Sep-Oct 5 Nov 6- Dec 7<br />
Bi-Monthly Period<br />
Figure 15: Above Atkinson Bi-Monthly Flow<br />
Atkinson<br />
Zinc concentrations are highest during the Winter months (November through February) and<br />
lowest during the late Summer months (July and August). <strong>Water</strong> quality standards for zinc are<br />
typically exceeded from November through June. Average zinc concentration reach three times<br />
the chronic zinc standard. Flows are the highest during the months <strong>of</strong> May and June.<br />
Page 25
<strong>Silver</strong> <strong>Creek</strong> <strong>Water</strong>shed TMDL Final Report<br />
Cadmium concentrations are lowest during the late Summer and early Autumn. Average<br />
concentrations are generally above chronic water quality standards.<br />
Zinc Concentration (mg/l)<br />
3.0<br />
2.5<br />
2.0<br />
1.5<br />
1.0<br />
0.5<br />
STORET Average (1990-2002)<br />
Overall Average<br />
STORET (1990-2002)<br />
USGS (2000)<br />
USGS (2002)<br />
Chronic Zn Standard (0.39)<br />
Atkinson (492674)<br />
Bi-Monthly Zinc Concentrations<br />
0.0<br />
0 Jan - 1 Feb Mar - Apr<br />
2 May - 3Jun<br />
Jul -<br />
4Aug<br />
Sep-Oct<br />
5<br />
Nov - Dec<br />
6 7<br />
Bi-Monthly Period<br />
Figure 16: Atkinson Bi-Monthly Zinc<br />
Atkinson (492674)<br />
Bi-Monthly Cadmium Concentrations<br />
Cadmium Concentration (mg/l)<br />
0.020<br />
0.018<br />
0.016<br />
0.014<br />
0.012<br />
0.010<br />
0.008<br />
0.006<br />
0.004<br />
STORET Average (1990-2002)<br />
Overall Average<br />
STORET (1990-2002)<br />
USGS (2000)<br />
Chronic Cd Standard (0.0008)<br />
0.002<br />
0.000<br />
0 Jan - 1 Feb Mar - Apr 2 May - 3Jun<br />
Jul - 4Aug<br />
Sep-Oct 5 Nov - Dec 6 7<br />
Bi-Monthly Period<br />
Figure 17: Atkinson Bi-Monthly Cadmium<br />
Page 26
<strong>Silver</strong> <strong>Creek</strong> <strong>Water</strong>shed TMDL Final Report<br />
Atkinson (492674)<br />
Bi-Monthly Flow<br />
35<br />
30<br />
25<br />
STORET Average (1990-2002)<br />
Overall Average<br />
STORET Samples (1990-2002)<br />
USGS (2002)<br />
Flow (cfs)<br />
20<br />
15<br />
10<br />
5<br />
0<br />
0<br />
Jan<br />
1- Feb Mar<br />
2- Apr<br />
May<br />
3- Jun<br />
Jul<br />
4- Aug Sep-Oct<br />
5 6<br />
Bi-Monthly Period<br />
Figure 18: Atkinson Bi-Monthly Flow<br />
Nov - Dec<br />
7<br />
Wanship<br />
Zinc concentrations are highest during the Winter and Spring months (Nov. – April). Flows are<br />
highest during the Spring and early Summer months (May and June).<br />
Wanship (492675)<br />
Bi-Monthly Zinc Concentrations<br />
Zinc Concentration (mg/l)<br />
1.8<br />
1.6<br />
1.4<br />
1.2<br />
1.0<br />
0.8<br />
0.6<br />
0.4<br />
STORET Average (1990-2002)<br />
Overall Average<br />
STORET Samples (1990-2002)<br />
USGS (2000)<br />
USGS (2002)<br />
Chronic Zn Standard (0.39)<br />
0.2<br />
0.0<br />
0 Jan 1 - Feb Mar<br />
2- Apr<br />
May 3- Jun<br />
Jul<br />
4- Aug Sep-Oct<br />
5<br />
Nov -<br />
6<br />
Dec<br />
7<br />
Bi-Monthly Period<br />
Figure 19: Wanship Bi-Monthly Zinc<br />
Page 27
<strong>Silver</strong> <strong>Creek</strong> <strong>Water</strong>shed TMDL Final Report<br />
Wanship (492675)<br />
Bi-Monthly Cadmium Concentrations<br />
Cadmium Concentration (mg/l)<br />
0.020<br />
0.018<br />
0.016<br />
0.014<br />
0.012<br />
0.010<br />
0.008<br />
0.006<br />
0.004<br />
STORET Average (1990-2002)<br />
Overall Average<br />
STORET (1990-2002)<br />
USGS (2000)<br />
Chronic Cd Standard (0.0008)<br />
0.002<br />
0.000<br />
0 Jan 1 - Feb Mar - 2Apr<br />
May 3- Jun<br />
Jul Nov - Dec<br />
4- Aug<br />
Sep-Oct 5 6 7<br />
Bi-Monthly Period<br />
Figure 20: Wanship Bi-Monthly Cadmium<br />
Wanship (492675)<br />
Bi-Monthly Flow<br />
100<br />
90<br />
80<br />
70<br />
STORET Average (1990-2002)<br />
Overall Average<br />
STORET Samples (1990-2002)<br />
USGS (2002)<br />
Flow (cfs)<br />
60<br />
50<br />
40<br />
30<br />
20<br />
10<br />
0<br />
0 Jan - 1Feb<br />
Mar - Apr 2 May - 3Jun<br />
Jul - 4Aug<br />
Sep-Oct 5 Nov - 6Dec<br />
7<br />
Bi-Monthly Period<br />
Figure 21: Wanship Bi-Monthly Flow<br />
Page 28
<strong>Silver</strong> <strong>Creek</strong> <strong>Water</strong>shed TMDL Final Report<br />
4.3 Hardness<br />
Seasonal analysis <strong>of</strong> hardness data for each <strong>of</strong> the five key sampling locations indicates that there<br />
is significant variation by season at all stations except 492685 (Richardson Flat). Appendix B<br />
includes graphical representation <strong>of</strong> the seasonal variation by station. While the sufficiency <strong>of</strong><br />
the data set does not allow a concise conclusion, there appears to by a general pattern that<br />
involves lower hardness values during spring run<strong>of</strong>f (March-July) than during more base flow<br />
conditions (August –February). This seasonal variation results in two stations (492695 – Park<br />
City and 492675 – Wanship) that demonstrate hardness values that are significantly below the<br />
hardness value <strong>of</strong> 400 used to calculate TMDL target values. Sections 8.1 and 8.2 include a<br />
discussion <strong>of</strong> how TMDL target levels were modified to accommodate seasonal variation for<br />
these two stations in order to assure stream water quality standards are maintained throughout the<br />
year at these two stations.<br />
4.4 Zinc and Cadmium Loading<br />
Table 8 summarizes the zinc and cadmium loading for the reach <strong>of</strong> <strong>Silver</strong> <strong>Creek</strong> between Park<br />
City and the confluence with the Weber River. Values for each bi-monthly period for each <strong>of</strong> the<br />
five key stations are shown. The average flows for each period along with the average dissolved<br />
zinc and cadmium concentrations for the period are used to compute average daily loads shown<br />
in the table. Another column, showing the load, presents totals for each bi-monthly period.<br />
Summing these bi-monthly numbers results in an annual load. The annual load for each station<br />
has been rounded to the nearest 1,000 pounds per year for zinc and to the nearest one pound per<br />
year for cadmium. This rounding is consistent with the statistical parameters developed for flow<br />
and concentration.<br />
Page 29
<strong>Silver</strong> <strong>Creek</strong> <strong>Water</strong>shed TMDL Final Report<br />
Table 8: Summary <strong>of</strong> Flows, Concentrations, and Loads by Key Station<br />
Period<br />
Average Flow<br />
(cfs)<br />
Average<br />
Dissolved<br />
Zinc (mg/l)<br />
Average<br />
Dissolved Zinc<br />
Load (lb/day)<br />
Dissolved<br />
Zinc Load<br />
(lb)<br />
Average<br />
Dissolved<br />
Cadmiuim<br />
(mg/l)<br />
Average<br />
Dissolved<br />
Cadmium Load<br />
(lb/day)<br />
Dissolved<br />
Cadmium<br />
Load (lb)<br />
Park City (492695)<br />
Jan-Feb 0.4 0.70 1.4 85 0.0048<br />
0.01 0.6<br />
Mar-Apr 3.6 0.65 12.4 759 0.0068<br />
0.13 7.9<br />
May-Jun 4.1 0.57 12.6 771 0.0055<br />
0.12 7.4<br />
Jul-Aug 0.3 0.21 0.4 23 0.0021<br />
0.00 0.2<br />
Sep-Oct 0.7 0.35 1.4 85 0.0018<br />
0.01 0.4<br />
Nov-Dec 0.9 0.47 2.2 136 0.0035<br />
0.02 1.0<br />
Annual Load: 2,000* 18**<br />
Richardson (492685)<br />
Jan-Feb 1.9 1.03 10.4 616 0.0023<br />
0.02 1.4<br />
Mar-Apr 4.3 1.17 27.1 1,655 0.0034<br />
0.08 4.8<br />
May-Jun 7.9 0.47 20.0 1,220 0.0008<br />
0.03 2.1<br />
Jul-Aug 1.9 0.74 7.4 458 0.0011<br />
0.01 0.7<br />
Sep-Oct 1.9 0.60<br />
6.0 365 0.0006 0.01 0.4<br />
Nov-Dec 1.7 1.08 9.7 590 0.0018<br />
0.02 1.0<br />
Annual Load: 5,000* 10**<br />
Above Atkinson (492680)<br />
Jan-Feb 3.9 2.90 61.5 3,627 0.0079<br />
0.17 9.9<br />
Mar-Apr 2.3 1.73 21.6 1,321 0.0045<br />
0.06 3.4<br />
May-Jun 3.6 1.81 35.5 2,168 0.0038<br />
0.07 4.5<br />
Jul-Aug 0.6 0.57<br />
1.9 118 0.0000 0.00 0.0<br />
Sep-Oct 1.7 0.05 0.5 28 0.0000 0.00 0.0<br />
Nov-Dec 2.9 3.15 48.6 2,964 0.0085<br />
0.13 8.0<br />
Annual Load: 10,000* 26**<br />
<strong>Silver</strong> <strong>Creek</strong> WWTP (492679)<br />
Jan-Dec 2.2 0.14 1.7 598 0.0000 0.00 0.0<br />
Annual Load:<br />
600<br />
Atkinson (492674)<br />
Jan-Feb 4.0 1.33 28.8 1,701 0.0030<br />
0.07 3.8<br />
Mar-Apr 6.1 1.09 35.7 2,180 0.0023<br />
0.08 4.6<br />
May-Jun 14.2 0.95 72.7 4,432 0.0027<br />
0.21 12.6<br />
Jul-Aug 2.8 0.15 2.3 142 0.0000 0.00 0.0<br />
Sep-Oct 5.1 0.38 10.5 641 0.0005 0.01 0.8<br />
Nov-Dec 5.8 1.59 49.9 3,045 0.0026<br />
0.08 5.0<br />
Annual Load: 12,000* 27**<br />
Wanship (492675)<br />
Jan-Feb 6.5 0.60<br />
20.9 1,235 0.0003 0.01 0.6<br />
Mar-Apr 19.8 0.69 73.5 4,486 0.0013<br />
0.14 8.4<br />
May-Jun 17.5 0.15 14.2 864 0.0000 0.00 0.0<br />
Jul-Aug 4.7 0.20 5.1 317 0.0010<br />
0.03 1.6<br />
Sep-Oct 4.0 0.16 3.4 209 0.0005 0.01 0.7<br />
Nov-Dec 5.8 0.47<br />
14.8 903 0.0005 0.02 1.0<br />
Annual Load: 8,000* 12**<br />
* Rounded to the nearest 1,000 lbs per year<br />
** Rounded to the nearest 1 lb per year<br />
Red Bold Type indicates Exceedence <strong>of</strong> Chronic <strong>Water</strong> <strong>Quality</strong> Standard<br />
Page 30
<strong>Silver</strong> <strong>Creek</strong> <strong>Water</strong>shed TMDL Final Report<br />
Table 9 presents the coefficients <strong>of</strong> variation for flow, zinc concentration, and cadmium<br />
concentration at each <strong>of</strong> these key locations.<br />
Table 9: Coefficients <strong>of</strong> Variation<br />
Location<br />
Dissolved Dissolved<br />
Zinc Cadmium Flow<br />
Park City 77% 93% 182%<br />
Richardson 58% 108% 112%<br />
Ab. Atkinson 108% 125% 99%<br />
<strong>Silver</strong> Ck. WRF 50% n/a 39%<br />
Atkinson 80% 113% 95%<br />
Wanship 87% 152% 137%<br />
The coefficient <strong>of</strong> variation is determined as the standard deviation <strong>of</strong> the population divided by<br />
its mean value. This is a measure <strong>of</strong> how tightly the data are clustered around the mean value.<br />
Lower numbers indicate that most <strong>of</strong> the data points are located close to the mean, while higher<br />
numbers indicated a wider spread <strong>of</strong> data points. The Above Atkinson and <strong>Silver</strong> <strong>Creek</strong> WRF<br />
sampling stations have the highest and lowest coefficients <strong>of</strong> variation, respectively, for zinc<br />
concentration. Thus, more confidence may be placed in the mean zinc value at the WRF than in<br />
the mean value at the Above Atkinson Station.<br />
The only Point Source in the watershed is the <strong>Silver</strong> <strong>Creek</strong> <strong>Water</strong> Reclamation Facility. Average<br />
annual loads for this facility are also shown in Table 8. The average zinc concentration and<br />
average flow for the water reclamation facility are 0.14 mg/l and 2.2 cfs, respectively. These<br />
levels result in an estimated average loading <strong>of</strong> 1.7 pounds per day or 598 pounds per year.<br />
There are no recorded samples in the data where cadmium is above the detection limit. This<br />
results in a calculated cadmium load <strong>of</strong> zero pounds per year.<br />
Table 10 shows the incremental loading between each <strong>of</strong> the five key stations. Also shown are<br />
the estimated distances, in miles, between each <strong>of</strong> the key stations as well as the incremental<br />
loading rate in pounds per year per mile <strong>of</strong> stream.<br />
Table 10: Incremental Loading Results<br />
Incremental<br />
Cadmium Load<br />
Cadmium Load<br />
Rate (lb/mi)<br />
Incremental Zinc Load<br />
Location Dist. (mi)<br />
Zinc Load (lb) Rate (lb/mi)<br />
-<br />
(lb)<br />
Park City 2.6 2,000 770 18 6.9<br />
Richardson 3.42<br />
3,000 900 -8 -2.4<br />
Ab. Atkinson 4.1 5,000 1,200 16 3.9<br />
Atkinson 0.5 2,000 4,000 1 2.0<br />
Wanship 7.5 -4,000 -500 -15 -2.0<br />
Page 31
<strong>Silver</strong> <strong>Creek</strong> <strong>Water</strong>shed TMDL Final Report<br />
For zinc, it is <strong>of</strong> interest to note that between Park City and Richardson the annual loading rate is<br />
900 pounds per year per mile <strong>of</strong> stream. Between Richardson and Above Atkinson the loading<br />
rate is in the same range, 1,200 pounds per year per mile. Between the two Atkinson stations<br />
(0.5 miles) the annual incremental load amounts to 2,000 pounds for a loading rate <strong>of</strong><br />
approximately 4,000 pounds per year per mile <strong>of</strong> stream. Between Atkinson and Wanship, the<br />
zinc loading actually decreases by 4,000 pounds per year. This decrease is likely associated with<br />
precipitation/sedimentation <strong>of</strong> zinc and incorporation <strong>of</strong> those materials into the sediments <strong>of</strong> that<br />
reach. This results in a loading rate <strong>of</strong> -500 pounds per year per mile <strong>of</strong> stream. While it is<br />
interesting to consider loading in a pounds per mile perspective, it is also important to recognize<br />
which stream reaches contribute the most loads. The segment between Richardson and above<br />
Atkinson is the largest source area in the watershed contributing some 5000 lbs/yr.<br />
For Cadmium, there is a loss <strong>of</strong> load between Park City and Richardson. Between Richardson<br />
and the Above Atkinson location, there is a gain <strong>of</strong> 16 pounds per year. A minor increase in load<br />
occurs progressing towards the Atkinson location. Similar to zinc, there is a significant loss <strong>of</strong><br />
cadmium load in the reach between Atkinson and Wanship, likely due to sedimentation.<br />
4.4 <strong>Water</strong> <strong>Quality</strong> Overview<br />
Zinc<br />
An analysis <strong>of</strong> Table 8 (page 30) leads to three important conclusions concerning <strong>Silver</strong> <strong>Creek</strong><br />
zinc concentrations:<br />
• Zinc concentrations tend to be the highest during periods <strong>of</strong> late Winter and Spring<br />
run<strong>of</strong>f.<br />
• Elevated concentrations <strong>of</strong> zinc occur throughout the reaches <strong>of</strong> <strong>Silver</strong> <strong>Creek</strong> between<br />
Park City and Wanship.<br />
• The highest concentrations <strong>of</strong> zinc were found at Above Atkinson, where bi-monthly<br />
averages were over five times the chronic water quality standard for four <strong>of</strong> the six<br />
bimonthly periods.<br />
Calculated loadings by stream reach point to potential remediation priorities. The largest load<br />
increments are in the reaches between Richardson and Atkinson; they amount to 7,000 pounds<br />
per year. Next in priority would be between Park City and Richardson with incremental load<br />
amounts <strong>of</strong> about 3,000 pounds per year.<br />
Lastly, annual load at Park City is about 2,000 pounds. However, careful consideration must<br />
also be given to the sequence <strong>of</strong> clean up from an upstream to downstream order to insure that<br />
upstream sources do not contaminate areas downstream that have been addressed earlier. This<br />
issue will be covered in detail in Section 10.0, Project Implementation Plan.<br />
Between Park City and Richardson, the incremental load amounts to about 3,000 pounds per<br />
year. Therefore, the focus <strong>of</strong> attention as far as remediation should be in the reach <strong>of</strong> <strong>Silver</strong><br />
<strong>Creek</strong> between Park City and Atkinson.<br />
Continued improvement in the upper watershed associated with active mine reclamation and<br />
resort development will likely continue to reduce the exposure <strong>of</strong> surface waters to mining<br />
Page 32
<strong>Silver</strong> <strong>Creek</strong> <strong>Water</strong>shed TMDL Final Report<br />
impacted areas and should reduce metal concentrations in this portion <strong>of</strong> the watershed. Areas in<br />
the watershed that are currently being developed include the upper watershed area and the East<br />
side <strong>of</strong> the meadow area (Figure 22). It is expected that all future development activities will<br />
avoid contaminated areas and, as a result, it is expected that these areas will not contribute zinc<br />
or cadmium load to <strong>Silver</strong> <strong>Creek</strong>.<br />
The reach <strong>of</strong> <strong>Silver</strong> <strong>Creek</strong> between Atkinson and Wanship shows a decrease <strong>of</strong> approximately<br />
one-third in zinc loadings. This is probably associated with precipitation/sedimentation, which<br />
suggests that the zinc is still present and could be mobilized by high flow events or a change in<br />
water chemistry. However, the historic data set that encompasses more than 10 years does not<br />
indicate that accumulated metals are being released in disproportionate quantities. Assuming<br />
that clean-up and remediation take place in the upper and central portion <strong>of</strong> the watershed,<br />
additional remediation in the lowest reach <strong>of</strong> the stream would be a last priority, undertaken if<br />
this reach appears problematic following watershed work upstream.<br />
Cadmium<br />
Some 52% <strong>of</strong> the cadmium observations exceeded the chronic water quality standard. Clean up<br />
priorities for cadmium based on loading analysis should be targeted at the stream reach above the<br />
Park City monitoring station and between Richardson and Atkinson.<br />
4.5 Zinc and Cadmium Geochemistry Overview<br />
Many heavy metals become more water soluble under acid conditions and can move downward<br />
with water through the soil, and in some cases move to aquifers, surface streams, or lakes. If<br />
these ions are found in high concentrations, their toxicity is dependent on water hardness, pH,<br />
temperature and the presence <strong>of</strong> other dissolved substances.<br />
The distribution and transport <strong>of</strong> zinc in water, sediment and soil are dependent upon the species<br />
<strong>of</strong> zinc present and the characteristics <strong>of</strong> the environment. The solubility <strong>of</strong> zinc is primarily<br />
determined by pH. At acidic pH values, zinc may be present in the aqueous phase in its ionic<br />
form. Zinc may precipitate at pH values greater than 8.0. It may also form stable organic<br />
complexes. The formation <strong>of</strong> such complexes can increase the mobility and/or solubility <strong>of</strong> zinc.<br />
Cadmium is also naturally present in soil but in a predominantly insoluble and harmless form.<br />
However, through pollution-formed pH-decreasing agents like acid-rain, the cadmium in the soil<br />
may convert into a soluble form, become available to plants and enter the food chain.<br />
Page 33
<strong>Silver</strong> <strong>Creek</strong> <strong>Water</strong>shed TMDL Final Report<br />
5.0 MARGIN OF SAFETY<br />
5.1 Assumptions<br />
All data for the analysis in this TMDL study was provided by the <strong>Utah</strong> Department <strong>of</strong><br />
Environmental <strong>Quality</strong> (DEQ), <strong>Division</strong> <strong>of</strong> <strong>Water</strong> <strong>Quality</strong> (DWQ). DWQ adheres to the DEQ<br />
DWQ <strong>Quality</strong> Assurance <strong>Quality</strong> Control Manual to ensure proper sampling and data validation<br />
from sampling through analysis. All samples are analyzed by Department <strong>of</strong> Health <strong>Division</strong> <strong>of</strong><br />
Laboratory Services (a.k.a. State Health Lab) which is EPA certified on its procedures. <strong>Quality</strong><br />
assurance procedures (i.e. blank and duplicate samples) are strictly adhered to and enforced.<br />
Seasonal trends and data scatter are such that it would be virtually impossible to demonstrate<br />
statistically valid long term trending. Therefore, it was assumed that there were no significant<br />
long term trends in the data.<br />
5.2 Margin <strong>of</strong> Safety<br />
A discussion <strong>of</strong> the statistical methods used to analyze the <strong>Silver</strong> <strong>Creek</strong> water quality and flow<br />
data is included in Appendix B. As pointed out in this appendix, although the statistical analysis<br />
resulted in satisfactory results, there remain significant uncertainties in the estimates <strong>of</strong><br />
representative concentrations and loadings based on the variability <strong>of</strong> the existing data. In<br />
recognition <strong>of</strong> this uncertainty the Margin <strong>of</strong> Safety for this TMDL will include the following<br />
components:<br />
• An explicit margin <strong>of</strong> safety <strong>of</strong> 25% is utilized in the allocation calculations for the <strong>Silver</strong><br />
<strong>Creek</strong> TMDL.<br />
• Ongoing Monitoring Program will be implemented.<br />
• Use <strong>of</strong> the maximum hardness <strong>of</strong> 400 in calculating the hardness adjusted <strong>Water</strong> <strong>Quality</strong><br />
Standards that are used as the endpoint for this TMDL (use <strong>of</strong> actual hardness would<br />
have resulted in a higher values for the <strong>Water</strong> <strong>Quality</strong> Standards).<br />
Page 34
<strong>Silver</strong> <strong>Creek</strong> <strong>Water</strong>shed TMDL Final Report<br />
6.0 SOURCES<br />
6.1 Known Sources <strong>of</strong> Contaminants<br />
Existing data were adequate for determining contaminant loading between data sampling points<br />
along <strong>Silver</strong> <strong>Creek</strong> (contaminant loading is presented in pounds per mile <strong>of</strong> stream rather than by<br />
responsible parties in Section 4.3). However, sufficient data are unavailable to adequately<br />
allocate contribution <strong>of</strong> contaminants by specific site. Further, there are numerous smaller<br />
source areas not specifically listed in Table 11 that undoubtedly contribute zinc and cadmium to<br />
the creek. Table 11 identifies the major land owners within the various major source areas <strong>of</strong><br />
<strong>Silver</strong> <strong>Creek</strong>. Figure 22 identifies the major contaminated areas, which are referred to as source<br />
areas.<br />
Table 11 : List <strong>of</strong> Known Sources<br />
Description<br />
Owner<br />
Upper <strong>Water</strong>shed Sources<br />
United Park City Mines<br />
Prospector Square groundwater drain Park City Municipal Corporation<br />
<strong>Silver</strong> Maple Claims<br />
BLM<br />
Flood Plain Tailings<br />
United Park City Mines<br />
Richardson Flats<br />
United Park City Mines<br />
Meadow Area<br />
Various Private Land Owners<br />
All indications suggest that the metals <strong>of</strong> concern in this watershed are from historical mining<br />
activities in the Park City area. Most <strong>of</strong> the mining activity occurred within the upper watershed,<br />
primarily within Empire Canyon. Tailings from these mines were stored onsite or removed to<br />
another location, typically downstream.<br />
Several downstream locations were used to further reduce and process the discarded mine<br />
tailings in an attempt to remove additional metals. The lower reaches <strong>of</strong> the stream have<br />
significant amounts <strong>of</strong> mine tailings that are easily detected by the casual observer. These<br />
locations include, but are not limited to, <strong>Silver</strong> Maple Claims, Richardson Flats, Flood Plain<br />
Tailings and the Meadow area.<br />
Contamination mechanisms vary from site to site but are generally attributed to surface or<br />
ground water contact with mining related metals contamination. The upper watershed, due to its<br />
overall steepness, is characterized by relatively high flow velocities and concentrations that have<br />
a tendency to carry sediments and other materials to receiving waters, in this case <strong>Silver</strong> <strong>Creek</strong><br />
and its tributaries. Contaminated areas that are exposed or saturated by shallow ground water<br />
will contribute to metals loading in the stream channels.<br />
The Upper watershed source area includes discharges from two mining tunnels, the Judge and<br />
Spiro Tunnels. The majority <strong>of</strong> these flows are captured for use in the Park City Municipal<br />
drinking water system. Zinc concentrations for these tunnels have been reported at 0.81 mg/l for<br />
the Judge and 0.22 mg/l for the Spiro Tunnel (NPDES Form 2A October 2002). Estimated zinc<br />
loads from the respective tunnel flows that actually enter <strong>Silver</strong> <strong>Creek</strong> are less than 100 lbs. per<br />
year from the Judge Tunnel and 300 lbs. per year from the Spiro Tunnel. These values are not<br />
Page 35
<strong>Silver</strong> <strong>Creek</strong> <strong>Water</strong>shed TMDL Final Report<br />
significant when contrasted with the upper watershed zinc loads that are estimated at 2000 lbs.<br />
per year.<br />
The Prospector Drain is also a significant source <strong>of</strong> metals to the creek in the upper part <strong>of</strong> the<br />
watershed. Available information suggests that this is a shallow groundwater drain installed to<br />
lower ground water tables in the Prospector Square area. The annual load from the drain cannot<br />
be estimated with complete accuracy since there is no data on flows from the drain during the<br />
spring run<strong>of</strong>f season. An estimate <strong>of</strong> loads from the drain assuming spring flows from the drain<br />
would be 30% higher than the base flows that have been measured results in an annual load<br />
estimate <strong>of</strong> 2,230 lbs/yr <strong>of</strong> zinc and 13.5 lbs/yr. <strong>of</strong> cadmium. These values will be further refined<br />
when a full year’s worth <strong>of</strong> flow data is obtained.<br />
Page 36
<strong>Silver</strong> <strong>Creek</strong> <strong>Water</strong>shed TMDL Final Report<br />
Figure 22: <strong>Silver</strong> <strong>Creek</strong> Contaminant Source Map<br />
Page 37
<strong>Silver</strong> <strong>Creek</strong> <strong>Water</strong>shed TMDL Final Report<br />
As the terrain flattens, flow velocities in the stream and from run<strong>of</strong>f events decrease and begin to<br />
deposit the sediments from the upper watershed. Increased sediment deposition leads to<br />
increased contamination at these locations (Park City, <strong>Silver</strong> Maple Claims, Meadow area).<br />
The middle to lower reaches (Flood Plain, Richardson Flats, Meadow area) are substantially<br />
flatter than the upstream reaches. These areas were used for tailing reprocessing and disposal.<br />
The landscape is littered with mounds <strong>of</strong> contaminated mine tailings. The meadow area from just<br />
below Richardson Flat to Atkinson is nearly completely covered with tailings. The stream<br />
channel runs through tailings for a stretch <strong>of</strong> approximately 4 miles in this meadow area. The<br />
contamination processes that are visually apparent include direct storm water run<strong>of</strong>f to the creek,<br />
direct stream contact with tailings and shallow ground water contact with tailings. The ground<br />
water table is fairly high and is believed to exchange freely with water in <strong>Silver</strong> <strong>Creek</strong>, thus<br />
increasing the contaminant load in the stream.<br />
The <strong>Silver</strong> <strong>Creek</strong> WRF is a relatively small source <strong>of</strong> zinc loading currently as it contributes<br />
approximately only 598 <strong>of</strong> the 12,000 lbs per year <strong>of</strong> zinc passing the Atkinson Station (See<br />
Table 8). This represents 5 percent <strong>of</strong> the total load at Atkinson. Additionally, none <strong>of</strong> the<br />
samples for zinc obtained at the WRF in the 12-year period <strong>of</strong> this study exceeded the water<br />
quality standard for zinc. However, once best management practices are implemented in <strong>Silver</strong><br />
<strong>Creek</strong>, the relative contribution <strong>of</strong> the WRF will become more significant. If growth projections<br />
for the WRF are met, the discharge volume will grow from a current value <strong>of</strong> 1.4 MGD to 2.0<br />
MGD in the next 10 years. This would result in the WRF contributing some 628 lbs. <strong>of</strong> zinc<br />
annually to a combined load at Atkinson after BMP implementation <strong>of</strong> 4,810 lbs. (13% <strong>of</strong> the<br />
combined load)<br />
Cadmium levels have consistently been below the detection limit, indicating that the WRF does<br />
not appear to be a contributor <strong>of</strong> cadmium to <strong>Silver</strong> <strong>Creek</strong>.<br />
The last stream reach (to Wanship) has no tailings or other sources <strong>of</strong> contaminants besides<br />
sediment loads within the stream. This reach is the only section <strong>of</strong> stream that exhibits reducing<br />
levels <strong>of</strong> contaminants, again probably due to contaminants being adsorbed or precipitated.<br />
Page 38
<strong>Silver</strong> <strong>Creek</strong> <strong>Water</strong>shed TMDL Final Report<br />
Table 12: Source Information<br />
Stream Reach Source(s) Owner(s) Supporting Studies<br />
Above Park City Upper <strong>Water</strong>shed United Park City Mines Empire Canyon Innovative<br />
Assessment Report, DEQ, DERR,<br />
2001<br />
Empire Canyon Draft EECA,<br />
United Park City Mines, 2003<br />
USGS WRI 03-4296, 2003; (<strong>Silver</strong><br />
Maple Claims Loading Study)<br />
Park City to<br />
Richardson Flat<br />
Prospector Square Park City Municipal<br />
<strong>Silver</strong> Maple Claims BLM<br />
Flood Plain Tails United Park City Mines<br />
Data Interpretation Report Upper<br />
<strong>Silver</strong> <strong>Creek</strong> <strong>Water</strong>shed, EPA,<br />
2001<br />
Richard Flat RI/FS, United Park<br />
City Mines, 2003<br />
USGS WRI 03-4296, 2003; (<strong>Silver</strong><br />
Maple Claims Loading Study)<br />
Richardson Flat<br />
United Park City Mines<br />
BLM <strong>Silver</strong> Maple Site<br />
Investigation, 2003<br />
<strong>Silver</strong> Maple Wetland Functional<br />
Assessment, Dynamac, 2003<br />
Macroinvertebrate Study <strong>of</strong> <strong>Silver</strong><br />
Maple Claims Area, Univ. <strong>of</strong> <strong>Utah</strong>,<br />
2003<br />
Geoprobe Coring Study; <strong>Silver</strong><br />
Maple Claims Area, Dynamac,<br />
2003<br />
Richardson Flat<br />
to Wanship<br />
Meadow Area<br />
Various Private Land<br />
Owners<br />
Data Interpretation Report Upper<br />
<strong>Silver</strong> <strong>Creek</strong> <strong>Water</strong>shed, EPA,<br />
2001<br />
Lower <strong>Silver</strong> <strong>Creek</strong> Innovative<br />
Assessment, DEQ, DERR, 2002<br />
USGS WRI 03-4296, 2003; (<strong>Silver</strong><br />
Maple Claims Loading Study)<br />
Data Interpretation Report Upper<br />
<strong>Silver</strong> <strong>Creek</strong> <strong>Water</strong>shed, EPA,<br />
2001<br />
6.2 Future sources<br />
United Park City Mines is actively reclaiming mining related disturbed areas in preparation for<br />
development construction planned for the upper watershed. Continued improvement in the<br />
upper watershed associated with resort development will likely continue to reduce the exposure<br />
Page 39
<strong>Silver</strong> <strong>Creek</strong> <strong>Water</strong>shed TMDL Final Report<br />
<strong>of</strong> metal contaminated materials and should reduce metal concentrations in this portion <strong>of</strong> the<br />
watershed. Areas in the watershed which are currently being developed include the upper<br />
watershed area and the East side <strong>of</strong> the meadow area. It is expected that all future development<br />
activities will avoid contaminated areas and, as a result, it is expected that these areas will not<br />
contribute zinc or cadmium load to <strong>Silver</strong> <strong>Creek</strong>.<br />
Page 40
7.0 TECHNICAL ANALYSIS<br />
<strong>Silver</strong> <strong>Creek</strong> <strong>Water</strong>shed TMDL Final Report<br />
Establishing a relationship between the in-stream water quality targets and source loading is a<br />
critical component <strong>of</strong> the TMDL development. Identifying the cause and effect relationship<br />
between pollutant loads and the water quality response is necessary to evaluate the loading<br />
capacity <strong>of</strong> the receiving water bodies. The loading capacity is the amount <strong>of</strong> pollutant that can<br />
be assimilated by the water body while still attaining and maintaining water quality standards.<br />
This section discusses the existing and estimated loadings for zinc and cadmium in the <strong>Silver</strong><br />
<strong>Creek</strong> watershed.<br />
7.1 Estimation <strong>of</strong> Existing Load<br />
Estimation <strong>of</strong> existing loads for zinc and cadmium were calculated using monitoring stations as<br />
described in Section 3.3 (Tables 6 & 7). STOrage and RETrieval (STORET) data was collected<br />
by the <strong>Utah</strong> <strong>Division</strong> <strong>of</strong> <strong>Water</strong> <strong>Quality</strong> over a thirteen-year period between 1990 and 2002, and<br />
covers the reach <strong>of</strong> <strong>Silver</strong> <strong>Creek</strong> from the Weber River at Wanship upstream to a station located<br />
near Bonanza Drive in Park City. Not all <strong>of</strong> the sampling stations were sampled consistently<br />
throughout this period. USGS conducted two separate studies on <strong>Silver</strong> <strong>Creek</strong>, one in 2000 and<br />
another in 2002. The USGS sampling locations cover the same reach <strong>of</strong> the stream as do the<br />
STORET stations. In the Year 2000, USEPA sampled during the Spring, Summer, and Autumn<br />
periods in the reach <strong>of</strong> the stream from the vicinity <strong>of</strong> Richardson Flats upstream to the<br />
headwaters <strong>of</strong> <strong>Silver</strong> <strong>Creek</strong>.<br />
7.2 Comparison <strong>of</strong> Existing Load and Loading Capacity<br />
A water hardness <strong>of</strong> 400 mg/l was used for establishing the water quality standards for zinc and<br />
cadmium. Target annual loads were calculated using hardness adjusted water quality standards.<br />
For zinc, the resulting water quality endpoint is 0.39 mg/l. For cadmium, the resulting water<br />
quality endpoint is 0.0008 mg/l.<br />
Data are presented in Section 4.0 in the form <strong>of</strong> average concentrations and flows for bi-monthly<br />
periods at each “key” sampling location. Table 7 presents a summary <strong>of</strong> average flows,<br />
concentrations and loads at key stations for each <strong>of</strong> these bi-monthly periods. This presentation<br />
allows for a seasonal analysis <strong>of</strong> the data for this TMDL. It is apparent that the period from<br />
November through February generally is the most critical from a metals concentration<br />
perspective with concentrations at their peak during this four month period. This pattern is<br />
evident in virtually all <strong>of</strong> the key stations analyzed. Accordingly, this four month period will be<br />
considered the most critical in achieving and maintaining water quality standards for <strong>Silver</strong><br />
<strong>Creek</strong>.<br />
In order to achieve the reductions desired, a list <strong>of</strong> Best Management Practices (BMPs) was<br />
developed for the cleanup and/or isolation <strong>of</strong> mining contaminated materials from stream flows.<br />
BMPs are discussed in Section 9.0. Removal efficiencies and costs for BMPs are discussed in<br />
Section 10.0. Utilizing the removal efficiencies for each BMP, reductions in zinc and cadmium<br />
loading values are calculated along with anticipated stream concentrations after BMP<br />
implementation. Completion <strong>of</strong> scheduled BMPs is expected to achieve and maintain the TMDL<br />
Page 41
<strong>Silver</strong> <strong>Creek</strong> <strong>Water</strong>shed TMDL Final Report<br />
endpoints for <strong>Silver</strong> <strong>Creek</strong>. Ongoing monitoring as BMPs are implemented will allow<br />
verification <strong>of</strong> progress made toward meeting the endpoints identified for this TMDL.<br />
Page 42
<strong>Silver</strong> <strong>Creek</strong> <strong>Water</strong>shed TMDL Final Report<br />
8.0 TMDL<br />
The purpose <strong>of</strong> the TMDL report is to provide an estimate <strong>of</strong> the acceptable load or the degree to<br />
which the current pollutants need to be decreased to attain the defined endpoints. This process is<br />
based on the following equation:<br />
∑WLAs<br />
+ ∑ LAs +<br />
TMDL = MOS<br />
Where:<br />
• WLA = Waste Load Allocation (for point sources – <strong>Water</strong> Reclamation Facility)<br />
• LA = Load Allocation (for non-point sources) = (target concentration) x (average flow)<br />
• MOS = Margin <strong>of</strong> Safety = 25%<br />
Table 13 summarizes the TMDL data for both zinc and cadmium. Data presented is in the form<br />
<strong>of</strong> annual load reduction needed and percent reduction required to attain the TMDL endpoints.<br />
Zinc<br />
Table 13: Zinc and Cadmium Load Allocations / Reductions<br />
Current Current<br />
TMDL<br />
Target Annual Waste<br />
Overall<br />
Annual<br />
Avg. Annual Annual NPS Load Load Margin Of Reduction<br />
Flow Load Load Allocation Allocation Safety Needed % Annual<br />
Location (cfs) (lbs/yr) 1 (lbs/yr) 2 (lbs/yr) (lbs/yr) 3 (lbs/yr) 4 (lbs/yr) Reduction<br />
Park City 1.7 1,859 870 5 652 0 217 989 65%<br />
Richardson 3.2 4,905 2,443 1,832 0 611 2,462 63%<br />
Above Atkinson 2.5 10,226 1,909 1,432 0 477 8,317 86%<br />
Atkinson 6.3 12,142 4,810 1,778 1,830 1203 7,332 70%<br />
Wanship 9.7 8,014 5,535 5 2,322 1,830 1384 2,479 48%<br />
1. Current Load = sum <strong>of</strong> Bimonthly loads in Table 7<br />
2. Using zinc concentration <strong>of</strong> 0.39 mg/l<br />
3. WLA for <strong>Silver</strong> <strong>Creek</strong> WWTP includes 2 MGD @ 0.30 mg/l<br />
4. Margin <strong>of</strong> Safety is 25%<br />
5. Target loads were adjusted at Park City to accommodate seasonally lower hardness levels during spring and fall flow periods.<br />
Target loads were also adjusted at the Wanship station to accommodate lower hardness levels during spring run<strong>of</strong>f<br />
Cadmium<br />
TMDL<br />
Target<br />
Current Current Annual Annual Waste<br />
Overall<br />
Annual<br />
Avg. Annual Load NPS Load Load Margin Of Reduction<br />
Flow Load (lbs/yr) Allocation Allocation Safety Needed % Annual<br />
Location cfs (lbs/yr) 1 2<br />
(lbs/yr) (lbs/yr) 3 (lbs/yr) 4 (lbs/yr) Reduction<br />
Park City 1.7 17.6 1.8 5 1.3 0.0 0.4 15.8 92%<br />
Richardson 3.2 10.3 4.8 3.6 0.0 1.2 5.5 65%<br />
Above Atkinson 2.5 25.8 3.7 2.8 0.0 0.9 22.1 89%<br />
Atkinson 6.3 26.8 9.4 2.4 4.6 2.4 17.4 74%<br />
Wanship 9.7 12.3 11.3 5 3.8 4.6 2.8 1.0 31%<br />
1. Current Load = sum <strong>of</strong> Bimonthly loads in Table 7<br />
2. Using cadmium concentration <strong>of</strong> 0.0008 mg/l<br />
3. WLA for <strong>Silver</strong> <strong>Creek</strong> WWTP includes 2 MGD @ 0.0008 mg/l<br />
4. Margin <strong>of</strong> Safety is 25%<br />
5. Target loads were adjusted at Park City to accommodate seasonally lower hardness levels during spring and fall flow periods.<br />
Target load were also adjusted at the Wanship station to accommodate lower hardness levels during spring run<strong>of</strong>f<br />
Page 43
<strong>Silver</strong> <strong>Creek</strong> <strong>Water</strong>shed TMDL Final Report<br />
8.1 Zinc<br />
All <strong>of</strong> the stations indicate TMDL reductions for zinc are required. The greatest reduction (86%)<br />
is needed in the stream reach between Richardson and Above Atkinson (Meadow Area on Figure<br />
22). However, all stream reaches except between Atkinson and Wanship require reductions <strong>of</strong><br />
63% or greater.<br />
Two stations (492695 – Park City and 492675 – Wanship) demonstrated seasonal variation in<br />
hardness values. Station 492695 exhibited lower hardness values during the March through June<br />
and in the September through December time periods. Station 492675 exhibited lower hardness<br />
values during the spring run<strong>of</strong>f period <strong>of</strong> March through June. Both <strong>of</strong> these instances showed<br />
average hardness values that were significantly below the 400 hardness standard used for<br />
calculating TMDL targets (see Appendix B for details). Accordingly, the zinc TMDL target<br />
concentrations for these two stations were calculated using the lowest bi-monthly average<br />
hardness values. This resulted in lower endpoints for these two stations <strong>of</strong> 0.26 mg/l and 0.29<br />
mg/l respectively for stations 492695 and 492675 in order to be sufficiently protective. These<br />
lower endpoints were used to calculate the annual TMDL target loads shown in Table 12.<br />
8.2 Cadmium<br />
TMDL reductions are required for cadmium at all stations based on the newly adopted water<br />
quality standard. The greatest reduction (92%) is needed above the Park City station (492695).<br />
All stream reaches except between Atkinson and Wanship need load reductions <strong>of</strong> 65% or<br />
greater.<br />
The cadmium TMDL target for the Park City and Wanship stations were adjusted downward in<br />
similar fashion to the zinc values to accommodate for seasonally lower hardness values as<br />
explained in section 8.1. The endpoints used for these two stations to calculate the annual<br />
TMDL target loads shown in Table 12 were 0.00053 mg/l and 0.00059 mg/l respectively for<br />
stations 492695 and 492675.<br />
8.3 <strong>Silver</strong> <strong>Creek</strong> <strong>Water</strong> Reclamation Facility<br />
The <strong>Silver</strong> <strong>Creek</strong> WRF is a relatively small source <strong>of</strong> zinc loading currently contributing<br />
approximately only 598 <strong>of</strong> the 12,000 lbs per year <strong>of</strong> zinc passing the Atkinson Station (See<br />
Table 8). This represents 5 percent <strong>of</strong> the total load at Atkinson. Additionally, none <strong>of</strong> the<br />
samples for zinc obtained at the WRF in the 12-year period <strong>of</strong> this study exceed the chronic<br />
water quality standard for zinc. If growth projections for the WRF are met, the discharge volume<br />
will grow from a current value <strong>of</strong> 1.4 MGD to 2.0 MGD in the next 10 years with an ultimate<br />
buildout at 4.3 MGD. The source <strong>of</strong> zinc in the <strong>Silver</strong> <strong>Creek</strong> WRF effluent is from the drinking<br />
water supply for Park City. As growth continues in the Snyderville Basin area, new sources <strong>of</strong><br />
drinking water will not have the background zinc concentrations currently evident in the drinking<br />
water supply. Existing sources are at maximum production and will not contribute any added<br />
water to the drinking water supply. New water sources will most probably come from waters not<br />
impacted by historic mining.<br />
Page 44
<strong>Silver</strong> <strong>Creek</strong> <strong>Water</strong>shed TMDL Final Report<br />
Projected zinc concentrations and annual loads from the WRF using estimated average zinc<br />
effluent concentrations, assuming new sources <strong>of</strong> drinking water have little if any metals, are<br />
shown in Table 14.<br />
The flows from the <strong>Silver</strong> <strong>Creek</strong> WRF provide significant dilution <strong>of</strong> zinc concentrations in<br />
<strong>Silver</strong> <strong>Creek</strong>. As the plant effluent flows grow and zinc concentrations are reduced, via<br />
increased inflows from source waters without measurable zinc values, this dilution impact will<br />
increase. The WRF provides a positive impact on water quality in <strong>Silver</strong> <strong>Creek</strong> in regards to<br />
metal concentrations.<br />
Table 14. Growth Projections; <strong>Silver</strong> <strong>Creek</strong> WRF<br />
<strong>Silver</strong> <strong>Creek</strong> WRF<br />
WRF Flows (MGD) Zn (mg/l) Load (lbs./yr.)<br />
Current 2003 1.4 0.14 598<br />
Est. by 2010 2 0.103 628<br />
Max Build-out 4.3 0.054 708<br />
A flow weighted mixing model was utilized to derive the required effluent limits for the <strong>Silver</strong><br />
<strong>Creek</strong> WRF for zinc. The following inputs and assumptions were included in this analysis:<br />
• A realistic growth component was incorporated into the analysis by utilizing the WRF’s<br />
growth projections. The current flow average for the plant <strong>of</strong> 1.4 MGD is expected to<br />
grow to 2.0 MGD over the next 10 years.<br />
• The historical effluent concentration <strong>of</strong> zinc and cadmium from the WRF <strong>of</strong> 0.14 mg/l<br />
and below detection level respectively, will be reduced given that new sources <strong>of</strong><br />
drinking water will come from sources not contributing metals and that the plant<br />
processes currently utilized should not change even if the average flows increase some<br />
30% (1.4 MGD to 2.0 MGD).<br />
• The effluent limit established must result in the downstream concentrations after mixing<br />
<strong>of</strong> the stream and the WRF effluent achieving the chronic water quality standards.<br />
• The zinc and cadmium loads from non-point sources will be reduced by 90% from<br />
implementation <strong>of</strong> best management practices (BMPs) outlined in sections 9.0 and 10.0.<br />
• An explicit margin <strong>of</strong> safety <strong>of</strong> 25% is included to provide assurance that the uncertainty<br />
in the existing data set and effectiveness <strong>of</strong> the BMP implementation in meeting the 90%<br />
reduction goal are accounted for.<br />
Zinc - Figure 23 depicts the required effluent concentration for zinc for the six seasons used for<br />
seasonal analysis. The most restrictive season <strong>of</strong> the year from a concentration perspective is the<br />
November through February time frame. The flow weighted mixing model results shown in<br />
Figure 23 indicate that the Nov/Dec time period effluent limit <strong>of</strong> 0.30 mg/l is the most stringent<br />
result over the entire year. If a 0.30 mg/l effluent limit is met for zinc throughout the year by the<br />
WRF, the downstream concentration <strong>of</strong> zinc after mixing with the stream should consistently<br />
achieve the hardness adjusted chronic water quality standard <strong>of</strong> 0.39 mg/l.<br />
Page 45
<strong>Silver</strong> <strong>Creek</strong> <strong>Water</strong>shed TMDL Final Report<br />
WWTP Effluent Limits Required<br />
To Meet WQ Stds. After Mixing w/ <strong>Silver</strong> <strong>Creek</strong><br />
Zinc mg/l<br />
0.60<br />
0.50<br />
0.40<br />
0.30<br />
0.20<br />
0.10<br />
0.00<br />
Current WWTP Effluent Average 0.14 mg/l<br />
Jan/Feb Mar/April May/June July/Aug Sept/Oct Nov/Dec<br />
Figure 23: <strong>Silver</strong> <strong>Creek</strong> WRF Zinc Effluent Limit Needed<br />
to Achieve <strong>Water</strong> <strong>Quality</strong> Standards in <strong>Silver</strong> <strong>Creek</strong> after Mixing<br />
Cadmium - The historical WRF effluent data for cadmium shows that virtually all <strong>of</strong> the values<br />
are below the detection limit. In order to be protective <strong>of</strong> the stream, an effluent limit that at<br />
least meets the new water quality standard should be imposed. It is unlikely that measurable<br />
contributions <strong>of</strong> cadmium will be detected from the <strong>Water</strong> Reclamation Facility.<br />
Effluent Limit Implementation - The time-frame for including the proposed effluent limits for<br />
the <strong>Silver</strong> <strong>Creek</strong> WRF is not urgent given that currently, the non-point source loads dwarf the<br />
point source contribution. The current zinc loads from NPS sources will undoubtedly take 5 to<br />
10 years for completion <strong>of</strong> the BMPs needed to address the NPS loads. Accordingly, the effluent<br />
limits for the <strong>Silver</strong> <strong>Creek</strong> WRF need not be in place until the NPS loads have been reduced by<br />
at least 75% <strong>of</strong> the target value through implementation <strong>of</strong> BMPs. Using zinc as the constituent<br />
<strong>of</strong> interest, this would translate into a load reduction <strong>of</strong> 7,670 lbs. needed at the “above<br />
Atkinson” station (or a total load <strong>of</strong> 2,556 lbs. <strong>of</strong> zinc measured at above Atkinson) to trigger the<br />
need for point source effluent limits to be in place.<br />
Page 46
9.0 BEST MANAGEMENT PRACTICES<br />
<strong>Silver</strong> <strong>Creek</strong> <strong>Water</strong>shed TMDL Final Report<br />
The following sections describe Best Management Practices (BMPs) for the cleanup and/or<br />
isolation <strong>of</strong> mining contaminated materials from stream flows. The list is not all inclusive as<br />
specific site conditions may change, requiring changes to the specific BMPs, or additional BMPs<br />
not listed herein.<br />
In general, there are two types <strong>of</strong> BMPs: source controls and treatment controls. Source controls<br />
focus on minimizing or eliminating the source <strong>of</strong> contamination so that contaminants are<br />
prevented from entering the stream system. Treatment controls are designed to remove a<br />
contaminant after it has entered the stream system.<br />
A third type <strong>of</strong> BMP, ordinances, are discussed briefly within each control description and again<br />
in Section 10.0, Project Implementation Plan (PIP).<br />
9.1 Source Control BMPs<br />
Slope Protection<br />
Slope protection BMPs are designed to minimize and protect exposed soil surfaces to help<br />
reduce erosion and the associated discharge <strong>of</strong> sediment to nearby streams. Sample slope<br />
protection BMPs include mulching, hydromulching, geotextile, matting, topsoiling, vegetating,<br />
and permanent surfacing. The use <strong>of</strong> cut<strong>of</strong>f ditches or swales at the top <strong>of</strong> the slopes is<br />
encouraged to keep run<strong>of</strong>f from entering the slope protection area.<br />
Storm Run<strong>of</strong>f Routing<br />
Storm run<strong>of</strong>f is responsible for carrying contaminated sediments from a contaminated site to the<br />
affected stream either by direct surface run-<strong>of</strong>f or by percolating into the soil and eventually into<br />
the stream via groundwater. BMPs included in this category are measures designed to divert run<strong>of</strong>f<br />
from entering the site, keep run-<strong>of</strong>f from leaving the site, or divert run-<strong>of</strong>f away from<br />
sensitive sites. Sample BMPs include temporary sediment trapping measures (silt fencing, straw<br />
bales), swales/ditches, berms, dikes, and storm drain systems.<br />
Isolation Measures<br />
Isolation measures require that contaminated soils be isolated either onsite or removed to a<br />
“secure location.” Isolating contaminated soils would include capping (above and below) with<br />
an impervious surface, i.e. clay, to prevent groundwater infiltration <strong>of</strong> contaminated run-<strong>of</strong>f<br />
(percolation), diversion <strong>of</strong> run-<strong>of</strong>f, and removal or enclosure (pipe) <strong>of</strong> stream channel through<br />
isolated area.<br />
Additionally, contaminated sediments within the stream channels may have to be removed and<br />
relocated to a secure site if sediment transport is a concern. Sealing the stream channel with<br />
clay, bentonite, or other impervious material may keep contaminated stream flows from entering<br />
the ground water or contaminated groundwater from entering the stream flows.<br />
Page 47
<strong>Silver</strong> <strong>Creek</strong> <strong>Water</strong>shed TMDL Final Report<br />
Temporary Erosion Control<br />
New construction activities will require permitting from the local, State, or Federal jurisdiction.<br />
Each jurisdiction should require an approved erosion control plan for stormwater pollution<br />
control. Sites within Park City jurisdiction that involve contaminated soils are subject to Park<br />
City’s Landscaping and Maintenance <strong>of</strong> Soil Cover ordinance (Chapter 15 Title 11 Park City<br />
Municipal Code) that requires contaminated soils be addressed prior to construction. Temporary<br />
erosion control measures include silt fencing, hay bales, diversion ditches, temporary<br />
sedimentation/debris basins, channel protection (riprap, matting), and vegetative buffers. Some<br />
temporary measures, i.e. diversion ditches, may become part <strong>of</strong> the permanent erosion control<br />
measures.<br />
9.2 Treatment Control BMPs<br />
<strong>Water</strong> Treatment BMPs<br />
Treatment BMPs are designed to remove contaminants/pollutants from flows (either run-<strong>of</strong>f or<br />
stream) and return treated water to the receiving water, in this case <strong>Silver</strong> <strong>Creek</strong>. BMPs in this<br />
category include water/sediment separators, treatment wetlands, enhanced wetlands.<br />
Page 48
10.0 PROJECT IMPLEMENTATION PLAN<br />
<strong>Silver</strong> <strong>Creek</strong> <strong>Water</strong>shed TMDL Final Report<br />
The <strong>Silver</strong> <strong>Creek</strong> TMDL water quality study has been a joint effort with numerous stakeholders.<br />
One <strong>of</strong> the significant regulatory programs involved along with the <strong>Utah</strong> <strong>Division</strong> <strong>of</strong> <strong>Water</strong><br />
<strong>Quality</strong> is the EPA and State Superfund (CERCLA) programs. Given the historical mining<br />
wastes that are the primary sources for the water quality impairment, an approach that is similar<br />
to a Superfund RI/FS process is appropriate for this study. This TMDL lays out the endpoints or<br />
water quality goals for the watershed along with loading allocations needed to achieve the<br />
identified endpoints. However, it is beyond the scope <strong>of</strong> this TMDL to provide a detailed plan or<br />
program for clean up measures associated with historical mining in this watershed. The detailed<br />
analysis <strong>of</strong> clean up options and remedies along with determination <strong>of</strong> responsible parties,<br />
possible funding sources, and scheduling <strong>of</strong> clean up operations is best handled using a<br />
cooperative watershed approach and following most <strong>of</strong> the functional steps used in the<br />
Superfund arena.<br />
Accordingly, the Implementation Measures that follow are only a very rough outline <strong>of</strong> possible<br />
approaches to remedy the water quality pollution present in <strong>Silver</strong> <strong>Creek</strong>. In this case, the PIP<br />
focuses on reducing the chronic levels <strong>of</strong> zinc and cadmium as listed in Table 13 (Section 8.0).<br />
Some <strong>of</strong> the approaches presented herein are worst case scenarios from a cost perspective and<br />
are in all likelihood too high to be considered. Much work is needed to identify the various<br />
alternatives for clean up, assign costs, assess feasibility and make a final determination.<br />
Accordingly, the detailed clean up plan and implementation for the <strong>Silver</strong> <strong>Creek</strong> <strong>Water</strong>shed will<br />
be handled by the EPA and State Superfund programs.<br />
Funding to accomplish the proposed clean up options poses a very challenging obstacle given<br />
that there is little if any federal monies from the Superfund program for this type <strong>of</strong> clean up. It<br />
will be incumbent upon stakeholders and members <strong>of</strong> the community to creatively locate funding<br />
sources and make certain that the priority and order <strong>of</strong> clean up projects is conducted in the most<br />
cost effective manner possible.<br />
The following sections describe implementation measures, contaminant removal efficiencies,<br />
order <strong>of</strong> magnitude costs, and a broad-based implementation schedule.<br />
10.1 Implementation Measures<br />
The following implementation measures should be undertaken to successfully achieve the<br />
endpoints identified:<br />
• Slope Protection (stabilization) – slopes containing contaminated mine tailings<br />
should be stabilized to prevent infiltration <strong>of</strong> water and dispersal <strong>of</strong> contaminants<br />
from run-<strong>of</strong>f. Slope stabilization measures were discussed in Section 9.0.<br />
• Storm run<strong>of</strong>f routing – The BMPs included in this category are measures designed to<br />
collect sediment produced onsite, divert run-on from entering the site, keep run<strong>of</strong>f<br />
from leaving the site, or divert run<strong>of</strong>f away from sensitive areas or certain site<br />
activities. Examples <strong>of</strong> measures are swales, berms, and detention/retention ponds.<br />
• Isolation measures – areas that have been identified as containing contaminated mine<br />
tailings should be isolated to prevent further contamination <strong>of</strong> <strong>Silver</strong> <strong>Creek</strong>, ground<br />
Page 49
<strong>Silver</strong> <strong>Creek</strong> <strong>Water</strong>shed TMDL Final Report<br />
water, and surrounding soils. Isolation measures will be dictated by the extent <strong>of</strong> the<br />
contamination as well as physical characteristics <strong>of</strong> the contaminated area. Measures<br />
can range from construction <strong>of</strong> diversion swales/ditches to re-route run-<strong>of</strong>f, to<br />
removal <strong>of</strong> contaminated material and remediation <strong>of</strong> contaminated site. At a<br />
minimum, erosion control measures should be established to prevent run-<strong>of</strong>f from<br />
entering and contaminated sediments from leaving contaminated sites.<br />
• Treatment Measures – Contaminated flows can effectively be treated with the use <strong>of</strong><br />
man-made or naturally occurring wetlands, i.e. <strong>Silver</strong> Maple Claims. Flows can be<br />
routed into wetlands with the appropriately designed inlet/outlet structures to ensure<br />
adequate retention time for the biological removal <strong>of</strong> contaminants in the water<br />
column. Off–site or tributary flows, i.e. storm run-<strong>of</strong>f, can be treated using local<br />
storm water programs, i.e. UPDES. Storm water can be managed using proper<br />
erosion control measures, following guidelines as established by the state and Federal<br />
<strong>gov</strong>ernments, and ensuring that storm water controls are being applied as necessary.<br />
• Ordinances – Local and State ordinances require the use <strong>of</strong> erosion control measures<br />
during construction or other disturbance activities. The Park City Landscaping and<br />
Maintenance <strong>of</strong> Soil Cover ordinance (LMSC) requires that contaminated soils, at<br />
construction sites, be isolated either by capping onsite or removal to an approved site.<br />
Table 15 describes the types <strong>of</strong> BMPs recommended and contaminant removal efficiencies<br />
within each BMP category.<br />
Table 15: Best Management Practices – Description and Removal Efficiencies<br />
BMPs Description Removal References<br />
Efficiency<br />
Slope Protection<br />
(Stabilization)<br />
topsoil Imported topsoil placed at a minimum 84% Strock, 1998;<br />
depth <strong>of</strong> 1 foot, sometimes seeded<br />
and treated to promote growth <strong>of</strong><br />
vegetation.<br />
Georgia<br />
Stormwater<br />
Manual;<br />
Idaho BMPs<br />
Geotextile or matting<br />
revegetation<br />
hard surfacing<br />
Storm Run<strong>of</strong>f Routing<br />
grading to ensure positive<br />
drainage<br />
Matting or fabric placed on steeper<br />
slopes for erosion control and to<br />
promote vegetation growth.<br />
Seeding or placement <strong>of</strong><br />
seed/mulch/compost mixture to<br />
promote vegetation growth and slope<br />
stabilization.<br />
Pavement or other impermeable<br />
surface to prevent infiltration <strong>of</strong> water<br />
to contaminated soils.<br />
Site grading to deter storm water<br />
from pooling on or entering<br />
contaminated site.<br />
80% Georgia<br />
Stormwater<br />
Manual;<br />
Idaho BMPs<br />
84% Strock, 1998;<br />
Georgia<br />
Stormwater<br />
Manual;<br />
Idaho BMPs<br />
100% Georgia<br />
Stormwater<br />
Manual<br />
84% Strock, 1998;<br />
Georgia<br />
Stormwater<br />
Page 50
Diversion ditches or berms<br />
storm drain system<br />
detention/retention basins<br />
Isolation Measures<br />
removal <strong>of</strong> contaminated soils<br />
onsite capping <strong>of</strong> contaminated<br />
soils<br />
clay-lined ditch or pipe<br />
<strong>Water</strong> Treatment<br />
wetland<br />
<strong>Silver</strong> <strong>Creek</strong> <strong>Water</strong>shed TMDL Final Report<br />
BMPs Description Removal<br />
Efficiency<br />
Ditches/swales/berms or other<br />
grading features to encourage water<br />
from entering contaminated sites or<br />
divert water to containment area<br />
within contaminated site.<br />
Use <strong>of</strong> storm drain system, i.e.:<br />
inlets, pipes, basins to route and<br />
contain run<strong>of</strong>f.<br />
Use <strong>of</strong> detention/retention basins to<br />
contain run<strong>of</strong>f onsite, possible allow<br />
sediments to settle out and be<br />
removed.<br />
Removal <strong>of</strong> contaminated soils to<br />
approved "isolated" area.<br />
Capping <strong>of</strong> contaminated soils on site<br />
using clay, topsoil, etc.<br />
Using "sealed" ditch or pipe to<br />
convey stream flows. Sealed ditch or<br />
pipe will prevent infiltration to<br />
groundwater and possibly addition <strong>of</strong><br />
further flows from storm run<strong>of</strong>f.<br />
Enhancement or creation <strong>of</strong> wetland<br />
either within the stream channel or<br />
<strong>of</strong>f channel for the removal <strong>of</strong> heavy<br />
metals using select plant species.<br />
sediment basin Use <strong>of</strong> sedimentation or stilling basin<br />
to allow sediments to settle out.<br />
Sediments can be removed from<br />
basin using excavating equipment<br />
and transported to an "isolated" site<br />
for final disposal.<br />
References<br />
Manual;<br />
Idaho BMPs<br />
84% Strock, 1998;<br />
Georgia<br />
Stormwater<br />
Manual;<br />
Idaho BMPs<br />
100% N/A<br />
80% Georgia<br />
Stormwater<br />
Manual;<br />
Idaho BMPs<br />
100% N/A<br />
84% Strock, 1998<br />
100% N/A<br />
>99% Bolis, 1991<br />
80% Strock, 1998;<br />
Georgia<br />
Stormwater<br />
Manual;<br />
Idaho BMPs<br />
Ordinances<br />
Erosion Control during<br />
construction activities<br />
Park City Soil Landscaping and<br />
Maintenance <strong>of</strong> Soil Cover<br />
ordinance<br />
NPDES, Local and State ordinance<br />
mandate temporary and permanent<br />
erosion control activities for all new<br />
construction. Disturbed areas shall<br />
be addressed to ensure that no<br />
sediment laden run<strong>of</strong>f is allowed to<br />
leave site.<br />
Soil testing, capping & isolation or<br />
removal to a permitted storage<br />
facility.<br />
80% Georgia<br />
Stormwater<br />
Manual;<br />
Idaho BMPs<br />
80 – 100% Park City LMSC<br />
Ordinance<br />
Page 51
N/A: Not Applicable<br />
<strong>Silver</strong> <strong>Creek</strong> <strong>Water</strong>shed TMDL Final Report<br />
BMPs Description Removal References<br />
Efficiency<br />
Superfund Designation <strong>of</strong> a Superfund site Site specific CERCLA<br />
would require full cleanup <strong>of</strong> that site. requirements cleanup<br />
Cleanup could include removal or<br />
standards<br />
capping <strong>of</strong> contaminated soils.<br />
Further data gathering and analysis will more effectively identify contaminated areas and<br />
applicable BMPs to manage these areas. Management schedules can also be developed once<br />
further data have been gathered and there has been review <strong>of</strong> this document by stakeholders and<br />
the public.<br />
10.2 Implementation Measures by Site<br />
The following are site specific BMPs for the <strong>Silver</strong> <strong>Creek</strong> watershed. Sites are listed sequentially<br />
from headwater downstream.<br />
Empire Canyon (Daly West Mine, Alliance Mine)<br />
The following information was taken from the Draft Engineering Evaluation/Cost Analysis for<br />
Empire Canyon, EPA ID No. 0002005981, March 2003. (Draft EE/CA)<br />
The Draft EE/CA established two response action objectives (RAOs) for Empire Canyon:<br />
1. Isolation <strong>of</strong> surface water from mine wastes in the Empire Canyon Site.<br />
2. Minimizing the potential for human exposure to elevated lead and arsenic concentrations<br />
on recreational trails.<br />
The recommended response action for the site is a combination <strong>of</strong>:<br />
1. Waste isolation with onsite repository; and<br />
2. Waste isolation on UPCM property (Richardson Flat), removal and <strong>of</strong>fsite disposal.<br />
Waste isolation involves isolating surface water from mine wastes using the following methods:<br />
• Excavating stream channels and reconstructing using riprap or culverts (Empire and<br />
Walker Webster stream channels).<br />
• Lining sections <strong>of</strong> stream channels with clay liners to keep water on surface (no<br />
infiltration).<br />
• Recreational trails containing contaminated soils will be covered with clean material.<br />
Some trail sections may be rerouted.<br />
• The Daly West mine dump will be recontoured and covered with clean material. Some<br />
surface water flow in the vicinity <strong>of</strong> the mine dump will be re-routed to minimize contact<br />
with contaminated materials.<br />
• Cut-<strong>of</strong>f ditches will be placed upstream from the Daly West mine dump to intercept<br />
run<strong>of</strong>f from above the site.<br />
• Surface water from the Empire, Daly Draw, and Walker Webster channels will be<br />
directed into a culvert and away from contaminated materials.<br />
Page 52
<strong>Silver</strong> <strong>Creek</strong> <strong>Water</strong>shed TMDL Final Report<br />
Mine waste removal and disposal:<br />
• Approximately 4,500 linear feet <strong>of</strong> stream channel will be remediated.<br />
• Approximately 2,500 linear feet <strong>of</strong> recreational trail will be remediated.<br />
• Portions <strong>of</strong> the Alliance and Daly West mine dumps will be re-graded and capped with<br />
clean material.<br />
• Excavated materials will be placed in an on site clay lined repository at the Daly West<br />
mine or transported <strong>of</strong>fsite to Richarson Flat where it will be contained within a tailings<br />
impoundment.<br />
The Draft EE/CA identifies the preferred alternative as being highly effective through the use <strong>of</strong><br />
erosion control/storm water routing measures, topsoil and revegetation, clay lined channels, pipe<br />
culverts, and contaminated soil removal.<br />
Daly West Mine (site inspection 11/8/2002)<br />
The Daly West Mine is located on the ski area within several hundred feet <strong>of</strong> a chair lift. The<br />
site has been graded to promote drainage <strong>of</strong> run-<strong>of</strong>f away from contaminated soils. Diversion<br />
ditches have been excavated to intercept and divert run-<strong>of</strong>f away from contaminated soils.<br />
Portions <strong>of</strong> the area have been covered with topsoil and revegetated. Part <strong>of</strong> a parking lot has<br />
been paved , essentially covering and protecting the tailings.<br />
Recommendations for this area include: analyze diversion ditches to determine the need for<br />
channel linings to prevent erosion by high water velocities; soil cover at a minimum <strong>of</strong> one foot<br />
depth; seed and treat soil to promote growth <strong>of</strong> vegetation; ensure that all drainage is diverted<br />
away from site.<br />
Mine Office Area (site inspection 11/8/2002)<br />
The area around the mine <strong>of</strong>fice is steeply sloped, unvegetated, and otherwise exposed to the<br />
elements. Some <strong>of</strong> the tailings have been covered by parking area and some topsoil. There is<br />
evidence <strong>of</strong> active erosion from run-<strong>of</strong>f.<br />
Recommendations include: regrading and covering the yard area with one foot <strong>of</strong> soil ensuring<br />
positive drainage away from the tailings, regraded area should be revegetated; the outer slope <strong>of</strong><br />
the embankment (composed <strong>of</strong> mine spoil) should be regraded to a stable slope <strong>of</strong> 2H:1V,<br />
covered with a minimum <strong>of</strong> one foot <strong>of</strong> soil, limed, fertilized and revegetated; the roadside<br />
ditch (at the toe <strong>of</strong> regraded slope) may carry the run-<strong>of</strong>f from the area to a sediment<br />
basin/wetland prior to its discharge into the area stream.<br />
Empire Canyon (site inspection 11/8/2002)<br />
Empire Canyon consists <strong>of</strong> a fairly large steep side slope covered by mine tailings. The stream<br />
channel is located a short distance from the toe <strong>of</strong> the slope. Rip rap has been placed within the<br />
channel for protection. Currently there is no run-<strong>of</strong>f diversion, erosion control, vegetation or<br />
other form <strong>of</strong> slope protection.<br />
Recommendations for this site range from onsite slope stabilization to removal <strong>of</strong> contaminated<br />
soils to a “secure” site.<br />
Page 53
<strong>Silver</strong> <strong>Creek</strong> <strong>Water</strong>shed TMDL Final Report<br />
• Slope stabilization: Slopes are fairly steep and would consequently not accept a layer <strong>of</strong><br />
topsoil without extensive erosion control measures and constant maintenance. A more<br />
permanent surface would be required, i.e. shotcrete or gunnite. A diversion swale at the<br />
top <strong>of</strong> the slope to intercept and re-route run-<strong>of</strong>f would also be required.<br />
• Removal <strong>of</strong> soils: A secure location would have to be prepared prior to soil relocation.<br />
Securing a site would involve rerouting all run<strong>of</strong>f and placing an impermeable seal to<br />
prevent leachate from percolating and entering groundwater.<br />
• Stream isolation: Stream reaches where contaminated run-<strong>of</strong>f may come in contact with<br />
the stream could be isolated either by piping the stream at that location or providing<br />
diversion ditches at the toe <strong>of</strong> the slope to intercept contaminated run-<strong>of</strong>f. Stream piping<br />
would take into consideration major flood events, seasonal flow variations,<br />
environmental permitting, and aesthetics. Diversion ditches at the toe <strong>of</strong> the slope would<br />
have to route water to a treatment facility prior to discharge to the stream. The treatment<br />
facility could be a separator or sedimentation basin. Treatment facilities typically have<br />
area and maintenance requirements.<br />
Prospector Square (site inspection 11/8/2002)<br />
Prospector Square is a developed area <strong>of</strong> Park City. It is home to several hotels, condominiums,<br />
restaurants, shopping complexes and single family homes. Shallow ground water is drained<br />
from Prospector Square via buried pipe directly to an open water pond (sub-surface) upstream <strong>of</strong><br />
the <strong>Silver</strong> Maple Claims area. Current BMPs include the Park City LMSC ordinance and the<br />
wetland complex. The Park City ordinance requires that developers address contaminated soils<br />
prior to construction. Contaminated soils are “capped” onsite to prevent <strong>of</strong>fsite transport <strong>of</strong><br />
pollutants. The soil cap must be vegetated and maintained.<br />
Recommended BMPs include: rerouting <strong>of</strong> the drainage pipe from Prospector Square away from<br />
<strong>Silver</strong> <strong>Creek</strong> to a constructed wetland area for treatment. The water from the treatment wetland<br />
will eventually make its way back to <strong>Silver</strong> <strong>Creek</strong>; enhance the existing wetland complex by<br />
enlarging the emergent marsh areas and by planting heavy metal removing plant species.<br />
Enhancement should also include site monitoring and maintenance. Additionally, ensuring that<br />
the Park City LMSC ordinance is enforced and that proper erosion control measures are<br />
employed during construction and other earth disturbing activities.<br />
<strong>Silver</strong> Maple Claims (site inspection 11/8/2002)<br />
<strong>Silver</strong> Maple Claims is located downstream <strong>of</strong> Park City and is comprised <strong>of</strong> a large wetland<br />
complex. The wetland complex includes open water and emergent marsh areas. Source <strong>of</strong> water<br />
into this area has been determined to be <strong>Silver</strong> <strong>Creek</strong>, groundwater, and ground water drainage<br />
from the Prospector Square area <strong>of</strong> Park City.<br />
Wetlands, specifically wetland vegetation, have been shown to effectively remove heavy metals<br />
from water. Proper management <strong>of</strong> the wetland complex at <strong>Silver</strong> Maple Claims will ensure<br />
continued removal <strong>of</strong> contaminants from <strong>Silver</strong> <strong>Creek</strong>. Rerouting <strong>of</strong> the drainage pipe from<br />
Prospector Square should reduce the amount <strong>of</strong> contaminants flowing downstream to <strong>Silver</strong><br />
Maples Claims.<br />
Recommended BMPs include: removal <strong>of</strong> contaminated tailings and construction <strong>of</strong> water<br />
control structures to manage surface flows from wetland complex to wetland complex.<br />
Page 54
<strong>Silver</strong> <strong>Creek</strong> <strong>Water</strong>shed TMDL Final Report<br />
Contaminated water within each wetland will become continuously cleaner as it is routed<br />
through the wetland complexes prior to discharge into the creek; enhance the existing wetland<br />
complexes by enlarging the emergent marsh areas and by planting heavy metal removing plant<br />
species. Enhancement should also include site monitoring and maintenance. Additionally,<br />
ensuring proper erosion control measures are employed during construction and other earth<br />
disturbing activities.<br />
Flood Plain Tailings (site inspection 11/8/2002)<br />
The flood plain tailings site is located on the north side <strong>of</strong> <strong>Silver</strong> <strong>Creek</strong>, between the Rail Trail<br />
and the access road to Richardson’s Flat. The site is characterized by “perched” wetlands and<br />
scrub-shrub vegetation. The source <strong>of</strong> water for the wetlands appears to be surface and ground<br />
water flowing from the west to the creek.<br />
Recommended BMPs include: either removal <strong>of</strong> contaminated tailings and or construction <strong>of</strong><br />
water control structures to manage surface flows from wetland complex to wetland complex and<br />
possibly to a constructed wetland area for treatment. Contaminated water within each wetland<br />
will become continuously cleaner as it is routed through the wetland complexes prior to<br />
discharge into the creek; enhance the existing wetland complexes by enlarging the emergent<br />
marsh areas and by planting heavy metal removing plant species. Enhancement should also<br />
include site monitoring and maintenance.<br />
Richardson Flat (site inspection 11/8/2002)<br />
At this time, it is believed that Richardson Flat is a potential contributor <strong>of</strong> contaminants to<br />
<strong>Silver</strong> <strong>Creek</strong>. Groundwater data including flows, flow direction, and contaminant concentrations<br />
is currently being collected and will be assessed by others in the future.<br />
Above Atkinson (site inspection 11/8/2002)<br />
The topography <strong>of</strong> the area is fairly flat for a 4-6 mile reach. The area is characterized by a<br />
slightly meandering stream channel, fairly wide vegetated flood channel, and widespread tailing<br />
deposits that includes some mounds <strong>of</strong> mine tailings. The stream channel runs through tailings<br />
for a stretch <strong>of</strong> approximately 4 miles in this meadow area. Anecdotal evidence suggests that<br />
tailings from the mines were brought to this area in an attempt to further extract valuable<br />
materials. One <strong>of</strong> the largest recovery operations in this area was the Big Four mill, in operation<br />
from approximately 1915 to 1918. The mill site has a large concentration <strong>of</strong> tailings depositions.<br />
There are currently no BMPs in place.<br />
Recommended BMPs include: removal <strong>of</strong> all contaminated materials to a secure location;<br />
stabilizing and isolating contaminated materials onsite. This may not be practicable due to the<br />
large geographic extent <strong>of</strong> the area covered by the tailings. Additionally, groundwater<br />
contributes to the flows in <strong>Silver</strong> <strong>Creek</strong> through this reach. Isolating the tailings may affect<br />
groundwater flows; “seal” the creek bed using clay, bentonite, or some other material thus<br />
preventing flow to or from <strong>Silver</strong> <strong>Creek</strong>. Again, sealing the creek may adversely affect flows if<br />
ground water is isolated from the creek.<br />
Other items to take into account when considering applicable BMPs are current irrigation<br />
practices. Numerous diversions exist along <strong>Silver</strong> <strong>Creek</strong> that allow farmers/ranchers to access<br />
water for irrigation and livestock use. The number <strong>of</strong> diversions and amount <strong>of</strong> water drawn<br />
Page 55
<strong>Silver</strong> <strong>Creek</strong> <strong>Water</strong>shed TMDL Final Report<br />
from the creek are unknown at this time. Also unknown is whether diverted water has had<br />
adverse effects on surrounding soils or groundwater.<br />
More data, i.e. groundwater, irrigation practices, soil analysis is required to effectively address<br />
the BMPs for this stretch <strong>of</strong> <strong>Silver</strong> <strong>Creek</strong>.<br />
<strong>Silver</strong> <strong>Creek</strong> <strong>Water</strong> Reclamation Facility<br />
<strong>Silver</strong> <strong>Creek</strong> WRF has historically been in compliance with state water quality standards for zinc<br />
and cadmium. Zinc values have averaged 0.14 mg/l and cadmium has never been detected at the<br />
site. It is expected that future patterns will be similar to historical ones. Cadmium levels should<br />
remain below the laboratory detection limit <strong>of</strong> 0.001 mg/l.<br />
Below Atkinson (site inspection 11/8/2002)<br />
This section <strong>of</strong> <strong>Silver</strong> <strong>Creek</strong>, as discussed in Section 4.4, does not appear to contribute to<br />
contaminant levels in the creek. BMPs implemented upstream from this section should have<br />
positive effects in contaminant levels. No BMPs are recommended at this time aside from<br />
continued monitoring.<br />
10.3 Implementation Measures Efficiencies and Costs<br />
Tables 16 and 17 present the BMP effectiveness and projected removal <strong>of</strong> zinc and cadmium for<br />
the five stream reaches <strong>of</strong> <strong>Silver</strong> <strong>Creek</strong>.<br />
Table 16:<br />
BMP Effectiveness – Zinc removal<br />
Stream Reach<br />
Length<br />
(miles)<br />
Zinc Annual Load<br />
Reduction Needed<br />
(lbs)<br />
Proposed<br />
BMP<br />
Removal<br />
Efficiency<br />
Projected<br />
Zinc Total<br />
Removal<br />
(lbs)<br />
Zinc Annual<br />
Stream Reach<br />
Load (lbs)<br />
Above Park City 2.6 1,859 989 80 - 100 % 1,487<br />
Park City to Richardson<br />
Flat 3.4 4,905 2,642 85 – 99% 4,169<br />
Richardson Flat to<br />
Above Atkinson 4.1 10,226 8,317 85 – 100% 8,692<br />
Above Atkinson to<br />
Atkinson 0.5 12,142 7,332 85 – 100% 10,320<br />
Atkinson to Wanship 7.5 8,014 2,479<br />
1. Removal estimates in this reach are based on upstream reductions already achieved.<br />
1.<br />
2,479 1 .<br />
Table 17:<br />
BMP Effectiveness – Cadmium removal*<br />
Page 56
Stream Reach<br />
Length<br />
(miles)<br />
<strong>Silver</strong> <strong>Creek</strong> <strong>Water</strong>shed TMDL Final Report<br />
Cadmium<br />
Annual Load<br />
(lbs)<br />
Cadmium Annual<br />
Load Reduction<br />
Needed (lbs)<br />
Proposed<br />
BMP<br />
Removal<br />
Efficiency<br />
Projected<br />
Cadmium<br />
Total<br />
Removal<br />
(lbs)<br />
Stream Reach<br />
Above Park City 2.6 17.6 15.8 80 - 100 % 14<br />
Park City to Richardson<br />
Flat 3.4 10.3 5.5 85 – 99% 8.7<br />
Richardson Flat to<br />
Above Atkinson 4.1 25.8 22.1 85 – 100% 21.9<br />
Above Atkinson to<br />
Atkinson 0.5 26.8 17.4 85 – 100% 22.8<br />
Atkinson to Wanship 7.5 12.3 1.0<br />
1. Removal estimates in this reach are based on upstream reductions already achieved.<br />
*The same BMPs will be used for Cadmium as will be used for Zinc.<br />
Costs<br />
The following item costs and assumptions were used for calculating costs <strong>of</strong> BMP<br />
implementation:<br />
*Excavation = $4/cu.yd.<br />
Excavation is to a depth <strong>of</strong> 4 feet and includes hauling<br />
materials to a maximum distance <strong>of</strong> 5 miles.<br />
**Topsoil = $15.50/cu.yd. Topsoil includes materials and spreading. All excavated<br />
areas will be topsoiled at a depth <strong>of</strong> 6” to 8”.<br />
*Lined Ditch = $50/ft.<br />
Ditch/stream liner will be concrete or clay.<br />
*36” Pipe Culvert = $60/ft Includes placement.<br />
*48” Pipe Culvert = $88/ft Includes placement.<br />
***Wetland Creation = $3/sq.ft. Includes earthwork and vegetation<br />
*<strong>Utah</strong> Department <strong>of</strong> Transportation - Statewide Standard Item Average Prices and Total Quantities 2002<br />
**Local Park City costs. For purposes <strong>of</strong> calculations, $15.50/cu.yd = $2.60/sq.yd @ 6” depth.<br />
***Brodie, 1993<br />
For purposes <strong>of</strong> cost estimating, it is assumed that <strong>Silver</strong> <strong>Creek</strong> will either be placed in a lined<br />
ditch or in a 48” pipe culvert. A 48” pipe should accommodate anticipated flows, storm events<br />
etc., can overflow into the irrigation system and be retained at the irrigation holding pond to the<br />
north.<br />
All contaminated soil will be excavated and removed to an approved repository (Richardson<br />
Flat). All disturbed areas shall be regraded and covered with 6 to 8 inches <strong>of</strong> topsoil.<br />
Costs are summarized by stream reach below and presented in Table 18. All costs are based on<br />
estimated area and length measurements taken from readily available maps.<br />
1.<br />
1.0 1.<br />
Table 18: Proposed BMPs, Efficiencies, and Costs<br />
Page 57
<strong>Silver</strong> <strong>Creek</strong> <strong>Water</strong>shed TMDL Final Report<br />
Reach<br />
Above Park City<br />
(Empire Canyon)<br />
Park City to<br />
Richardson Flat<br />
BMPs Proposed<br />
Slope Protection Stabilization;<br />
Storm Run<strong>of</strong>f Routing; Isolation<br />
Measures<br />
Slope Protection Stabilization;<br />
Storm Run<strong>of</strong>f Routing; Isolation<br />
Measures; <strong>Water</strong> Treatment;<br />
Ordinances<br />
BMP Efficiency (%<br />
contaminant removal) BMP Cost<br />
80 - 100 % $1.17 million*<br />
85 - 99 % $8.33 million to<br />
$9.01 million<br />
Richardson Flat to<br />
Above Atkinson<br />
Above Atkinson to<br />
Atkinson<br />
Storm Run<strong>of</strong>f Routing; Isolation<br />
Measures<br />
Storm Run<strong>of</strong>f Routing; Isolation<br />
Measures<br />
85 – 99 % $101.72 million to<br />
$102.54 million<br />
85 - 100 % $9.58 million to<br />
$9.68 million<br />
Atkinson to Wanship None n/a n/a<br />
*Cost estimate from Draft Empire Canyon EE/CA<br />
n/a = not applicable<br />
Above Park City<br />
Cost estimates for this portion were calculated in the Draft Empire Canyon EE/CA at<br />
approximately $1.7 million.<br />
Park City to Richardson Flat<br />
<strong>Silver</strong> Maple Claim and Flood Plain Tails are included in this section.<br />
The stream reach from Park City to Richardson Flat is approximately 3.4 miles in length.<br />
Isolation <strong>of</strong> the stream would require a pipe culvert or lined ditch/stream channel.<br />
Lined ditch/stream = (3.4 miles)($50/ft) = $897,600.00<br />
or 48” pipe culvert = (3.4 miles)($88/ft) = $1,579,776.00<br />
The BLM proposes to move contaminated tailings from the <strong>Silver</strong> Maple Claim site to an<br />
approved repository. The area containing contaminated soils is approximately 60 acres is size.<br />
Approximately 387,197 cubic yards <strong>of</strong> material would be excavated and moved.<br />
Excavation = (387,197 cu.yd.)($4.00/cu.yd.) = $1,548,788.00<br />
Top soil = (290,398 sq.yd.)($2.60/sq.yd.) = $755,034.80<br />
Excavation and Topsoil Total = $2,303,822.80<br />
Contaminated tailings from the Floodplain Tails site would be moved to an approved repository.<br />
The area containing contaminated soils is approximately 130 acres is size. Approximately<br />
838,927 cubic yards <strong>of</strong> material would be excavated and moved.<br />
Excavation = (838,927 cu.yd.)($4.00/cu.yd.) = $3,355,708.00<br />
Top soil = (629,195 sq.yd.)($2.60/sq.yd.) = $1,635,907.00<br />
Page 58
<strong>Silver</strong> <strong>Creek</strong> <strong>Water</strong>shed TMDL Final Report<br />
Excavation and Topsoil Total = $4,991,615.00<br />
Wetland at <strong>Silver</strong> Maple Claims Complex<br />
The Wetland is sized based on the maximum daily metal load (Zn and Cd) <strong>of</strong> 12.73 lbs/day<br />
(5774 gms/day) and metal removal capacity <strong>of</strong> 4.3 gms/day/m 2 <strong>of</strong> wetland surface area . Wetland<br />
area required is approximately 0.34 acres (1342 m 2 ).<br />
(0.34 acres)(43560 sq. ft./acre)($3.00/sq.ft.) = $44,431.00<br />
Wetlands at Flood Plain Tailings<br />
The Wetland is sized based on the maximum daily metal load (Zn and Cd) <strong>of</strong> 27.18 lbs/day<br />
(12,329 gms/day) and metal removal capacity <strong>of</strong> 4.3 gms/day/m 2 <strong>of</strong> wetland surface area .<br />
Wetland area required is approximately 0.71 acres (2867 m 2 ).<br />
(0.71 acres)(43560 sq. ft./acre)($3.00/sq.ft.) = $92,782.80<br />
Richardson Flat to Above Atkinson<br />
The stream reach from Richardson Flat to Above Atkinson is approximately 4.1 miles in length.<br />
Isolation <strong>of</strong> the stream would require a pipe culvert or lined ditch/stream channel.<br />
Lined ditch/stream = (4.1 miles)($50/ft) = $1,082,400.00<br />
or 48” pipe culvert = (4.1 miles)($88/ft) = $1,905,024.00<br />
The area containing contaminated soils is approximately 2621 acres in size. Moving<br />
contaminated tailings material to an approved repository would involve the excavation <strong>of</strong><br />
16,914,070 cubic yards <strong>of</strong> material.<br />
Excavation = (16,914,070 cu.yd.)($4.00/cu.yd.) = $67,656,280.00<br />
Top soil = (12,685,540 sq.yd.)($2.60/sq.yd.) = $32,982,404.00<br />
Excavation and Topsoil Total = $100,638,684.00<br />
Above Atkinson to Atkinson<br />
The stream reach from Above Atkinson to Atkinson is approximately 0.5 miles in length.<br />
Isolation <strong>of</strong> the stream would require a pipe culvert or lined ditch/stream channel.<br />
Lined ditch/stream = (0.5 miles)($50/ft) = $132,000.00<br />
or 48” pipe culvert = (0.5 miles)($88/ft) = $232,320.00<br />
The area containing contaminated soils is approximately 246 acres in size. Moving<br />
contaminated tailings material to an approved repository would involve the excavation <strong>of</strong><br />
1,587,519 cubic yards <strong>of</strong> material.<br />
Excavation = (1,587,519 cu.yd.)($4.00/cu.yd.) = $6,350,076.00<br />
Top soil = (1,190,631 sq.yd.)($2.60/sq.yd.) = $3,095,640.60<br />
Page 59
<strong>Silver</strong> <strong>Creek</strong> <strong>Water</strong>shed TMDL Final Report<br />
Excavation and Topsoil Total = $9,445,716.60<br />
*The preceding list <strong>of</strong> implementation measures and costs does not include possible wetland<br />
mitigation costs associated with the Army Corps <strong>of</strong> Engineers 404 permitting process. These<br />
costs would need to be developed on a project by project basis as more detailed planning is<br />
undertaken.<br />
10.4 Implementation Schedule<br />
Empire Canyon EE/CA - Fall 2003, clean up begins late Fall 2003, Spring 2004<br />
BLM/<strong>Silver</strong> Maple Claim – Draft EE/CA Fall 2004, clean up begins following resolution <strong>of</strong><br />
Prospector Drain treatment.<br />
Richardson Flat – Decision document late 2003/early 2004 (EPA Action Memo regarding use <strong>of</strong><br />
site for repository)<br />
Prospector Square – new soils ordinance Fall 2003, ongoing monitoring (water in pipe) through<br />
Summer 2004.<br />
All cleanup and containment <strong>of</strong> contaminated sites should be complete by 20014, assuming a ten<br />
year cleanup period beginning January 2004. Implementation is subject to adequate funding.<br />
Page 60
<strong>Silver</strong> <strong>Creek</strong> <strong>Water</strong>shed TMDL Final Report<br />
11.0 TMDL EVALUATION AND MONITORING PLAN<br />
An ongoing water quality monitoring program will be required to assess the affect <strong>of</strong> clean up<br />
and remediation work in the <strong>Silver</strong> <strong>Creek</strong> watershed. It is anticipated that as clean up progresses,<br />
metal concentrations in the water column will decrease proportionately. Since there is a degree<br />
<strong>of</strong> uncertainty regarding the actual effectiveness <strong>of</strong> any non-point source clean up, actual<br />
monitoring <strong>of</strong> water quality is the best measure <strong>of</strong> success. The table below outlines the<br />
monitoring program planned for <strong>Silver</strong> <strong>Creek</strong> over the next 5 years. The program establishes an<br />
intensive program every 5 th year with quarterly monitoring in the intervening years. The <strong>Division</strong><br />
<strong>of</strong> <strong>Water</strong> <strong>Quality</strong> will undertake the sampling and analysis responsibilities for this program.<br />
Table 19: <strong>Division</strong> <strong>of</strong> <strong>Water</strong> <strong>Quality</strong> Monitoring Program for <strong>Silver</strong> <strong>Creek</strong><br />
Station Storet No. Frequency<br />
SILVER CREEK AT CITY PARK ABOVE<br />
PROSPECTOR SQUARE<br />
492695<br />
SILVER CREEK AT US40 CROSSING EAST<br />
OF PARK CITY 492685<br />
SILVER CREEK ABOVE ATKINSON<br />
492680<br />
SILVER CREEK WRF 492679<br />
SILVER CREEK AT FARM CROSSING IN<br />
ATKINSON 492674<br />
ALEXANDER CREEK AT HIGHWAY<br />
CROSSING 492670<br />
SILVER CREEK AT WANSHIP ABOVE<br />
CONFLUENCE WITH WEBER RIVER 492675<br />
2004 - 2007<br />
Schedule B;<br />
2003 & 2008<br />
Schedule A<br />
same as<br />
492695<br />
same as<br />
492695<br />
same as<br />
492695<br />
same as<br />
492695<br />
same as<br />
492695<br />
same as<br />
492695<br />
No. <strong>of</strong><br />
Samples<br />
4 for Schedule<br />
A; 16 for<br />
Schedule B<br />
same as<br />
492695<br />
same as<br />
492695<br />
same as<br />
492695<br />
same as<br />
492695<br />
same as<br />
492695<br />
same as<br />
492695<br />
Parameters<br />
Chemistry Type 2;<br />
Metals Type 3;<br />
Nutrient Type 9<br />
same as 492695<br />
same as 492695<br />
same as 492695<br />
same as 492695<br />
same as 492695<br />
same as 492695<br />
Frequency<br />
A. Biweekly March thru July; snowmelt to low flow (approx 9 events); monthly during low flow<br />
(approx August - Feb; 7 events.)<br />
B. Quarterly<br />
Parameters<br />
Chemistry Type 2: Bicarbonate, Carbonate, Chloride, Hydroxide, pH, Specific Conductance, Sulfate, Total<br />
Alkalinity, Total Dissolved Solids, Total Hardness, Total Suspended Solids, and Turbidity.<br />
Metals Type 3: Dissolved Aluminum, Arsenic, Barium, Cadmium, Chromium, Copper, Iron, Lead, Manganese,<br />
Mercury, Selenium, <strong>Silver</strong>, Zinc, Calcium, Magnesium, Potassium, Sodium<br />
Nutrient Type 9: Ammonia, Dissolved Nitrite & Nitrate, Total Phosphorus, Total Dissolved Phosphorus<br />
Results from the monitoring program will be reviewed annually and any adjustments needed to<br />
the program will be made.<br />
Page 61
12.0 PUBLIC PARTICIPATION<br />
12.1 Public Participation Meetings<br />
<strong>Silver</strong> <strong>Creek</strong> <strong>Water</strong>shed TMDL Final Report<br />
A public participation meeting was held on September 13, 2001 at the Miners Hospital<br />
Community Center in Park City, <strong>Utah</strong>. The public was notified <strong>of</strong> the meeting through the local<br />
news media. In addition, a letter <strong>of</strong> invitation was sent to local stakeholders and citizens to<br />
inform them <strong>of</strong> the public meeting. This meeting was designed to provide information and<br />
education on the TMDL process.<br />
A public meeting was held on August 19, 2003 at the Empire Canyon Day Lodge at the Deer<br />
Valley Lodge at the Deer Valley Ski Resort in Park City, <strong>Utah</strong>. The purpose <strong>of</strong> the meeting was<br />
to present the Engineering Evaluation / Cost Analysis (EE/CA) required for cleanup work to<br />
begin in Empire Canyon. Details <strong>of</strong> the TMDL study were discussed at the public meeting.<br />
12.2 Subcommittees and Groups<br />
Throughout this project, the Upper <strong>Silver</strong> <strong>Creek</strong> <strong>Water</strong>shed Stakeholders Group functioned as<br />
the nucleus for the Technical Advisory Committee or Steering Committee. Several meetings<br />
were held by this group to discuss the development <strong>of</strong> the <strong>Silver</strong> <strong>Creek</strong> TMDL. Specifically, this<br />
committee was comprised <strong>of</strong> individuals that represent the interests <strong>of</strong> stakeholders in the <strong>Silver</strong><br />
<strong>Creek</strong> watershed, including environmental engineering consultants, potential responsible parties,<br />
and representatives from state and federal <strong>gov</strong>ernment regulatory agencies.<br />
The Upper <strong>Silver</strong> <strong>Creek</strong> <strong>Water</strong>shed Stakeholders Group was formed to investigate environmental<br />
issues related to hazardous substances in the <strong>Silver</strong> <strong>Creek</strong> <strong>Water</strong>shed and the Park City area. To<br />
provide a public information service and forum, the Upper <strong>Silver</strong> <strong>Creek</strong> <strong>Water</strong>shed Stakeholders<br />
Group operates a website: http://www.silvercreekpc.org. At the website, the public can learn<br />
more about the <strong>Silver</strong> <strong>Creek</strong> TMDL and can express opinions to the stakeholder group.<br />
The Upper <strong>Silver</strong> <strong>Creek</strong> <strong>Water</strong>shed Stakeholders Group represents a wide range <strong>of</strong> interests that<br />
not only include community leaders, residents, and landowners, but also federal, state, and local<br />
<strong>gov</strong>ernments. This stakeholder group is intended to provide a forum for discussion, not to create<br />
a voting or decision-making body. Membership is not closed and may be expanded beyond the<br />
membership listed below:<br />
• Tom Bakaly, City Manager, Park City<br />
• Kerry Gee, United Park City Mines<br />
• Ty Howard, <strong>Utah</strong> Department <strong>of</strong> Environmental <strong>Quality</strong><br />
• John Whitehead, <strong>Utah</strong> Department <strong>of</strong> Environmental <strong>Quality</strong><br />
• Sally Elliot, Historic Preservation and Prospector Park<br />
• Dana Williams, Mayor, Park City<br />
• Bruce Waddell, US Fish and Wildlife Service<br />
• Steve Jenkins and Pat Cone, Summit County<br />
• Jim Christiansen, US Environmental Protection Agency<br />
• Bob Wells, Deer Valley Mountain Resort<br />
Page 62
<strong>Silver</strong> <strong>Creek</strong> <strong>Water</strong>shed TMDL Final Report<br />
• Brian Strait, Park City Mountain Resort<br />
• Mike Nelson and Tim Ingwell, Bureau <strong>of</strong> Land Management<br />
• John Knudsen, <strong>Utah</strong> State Parks <strong>Division</strong><br />
• Chuck Hollingshead, Citizens for Responsible Growth<br />
• Michael Luers, Snyderville Basin <strong>Water</strong> Reclamation District<br />
Following the project kick<strong>of</strong>f meeting on March 20, 2001, the Upper <strong>Silver</strong> <strong>Creek</strong> <strong>Water</strong>shed<br />
Stakeholders Group held several meetings that included discussion <strong>of</strong> the development <strong>of</strong> the<br />
<strong>Silver</strong> <strong>Creek</strong> TMDL.<br />
On March 18, 2003, the Upper <strong>Silver</strong> <strong>Creek</strong> <strong>Water</strong>shed Stakeholders Group held a meeting to<br />
discuss the completion <strong>of</strong> the <strong>Silver</strong> <strong>Creek</strong> TMDL.<br />
On May 13, 2003, the Upper <strong>Silver</strong> <strong>Creek</strong> <strong>Water</strong>shed Stakeholders Group held a meeting to<br />
update the group on the efforts by the various entities involved – BLM, UPCM/EPA, DWQ<br />
(TMDL), Park City Municipal Corporation.<br />
On July 8, 2003, the Upper <strong>Silver</strong> <strong>Creek</strong> <strong>Water</strong>shed Stakeholders Group held a meeting to<br />
discuss the status <strong>of</strong> the Empire Canyon EE/CA, Park City Soils Ordinance, and other documents<br />
recently released as part <strong>of</strong> the <strong>Silver</strong> <strong>Creek</strong> project.<br />
On February 24, 2004 the Upper <strong>Silver</strong> <strong>Creek</strong> <strong>Water</strong>shed Stakeholders Group held a meeting.<br />
An overview <strong>of</strong> the draft TMDL for <strong>Silver</strong> <strong>Creek</strong> was presented to the committee.<br />
The formal 30 day public comment period for the draft TMDL concluded on March 8, 2004.<br />
The 30 day comment period was advertised in the Salt Lake Tribune and Park Record<br />
newspapers. The draft TMDL was also posted on the <strong>Division</strong> <strong>of</strong> <strong>Water</strong> <strong>Quality</strong>’s web site for<br />
ease in accessing the draft document. Comments received and the corresponding responses are<br />
provided in Appendix C.<br />
Page 63
<strong>Silver</strong> <strong>Creek</strong> <strong>Water</strong>shed TMDL Final Report<br />
13.0 REFERENCES<br />
Bolis, Judith L., Thomas R. Wildeman, and Ronald R. Cohen. National Meeting <strong>of</strong> the<br />
American Society for Surface Mining and Reclamation, Durango, Colorado, May 14-17, 1991.<br />
“The Use <strong>of</strong> Bench Scale Permeameters for Preliminary Analysis <strong>of</strong> Metal Removal from Acid<br />
Mine Drainage by Wetlands”<br />
Brodie, Gregory A., Thomas Wildeman, Gregory Brodie, James Gusek. “Staged, Aerobic,<br />
Wetlands-Based Acid Drainage Treatment Systems Design, Construction, and Operations.”<br />
Wetland Design for Mining Operations-Section II, BiTech Publishers, Ltd. 1993.<br />
Brough, Griffin, Richardson, Stevens. <strong>Utah</strong> Weather Guide. Published by Society for Applied<br />
Climatology, West Jordan, <strong>Utah</strong>. Printed by Brigham Young University Printing Service, Provo,<br />
<strong>Utah</strong>. 1983.<br />
Georgia Stormwater Management Manual. Volume 2 (Technical Handbook).<br />
Idaho <strong>Division</strong> <strong>of</strong> Environmental <strong>Quality</strong>, <strong>Water</strong>shed and Aquifer Protection Bureau, July 1997.<br />
Catalog <strong>of</strong> Storm <strong>Water</strong> Best Management Practices For Idaho Cities and Counties.<br />
Kimball, Briant, Kevin Johnson, Robert L. Runkel, and Judy Steiger; “Quantification <strong>of</strong> Metal<br />
Loading to <strong>Silver</strong> <strong>Creek</strong> Through the <strong>Silver</strong> Maple Claims Area, Park City, <strong>Utah</strong>, May 2002”;<br />
USGS <strong>Water</strong>-Resources Investigation Report 03-4296, Salt Lake City, 2003.<br />
"Stream, Lake, Estuary, and Ocean Pollution" Nemerow, Nelson L. 2nd Edition. 1991. Page 245<br />
Strock, Nevil, Pennsylvania Department <strong>of</strong> Environmental Protection, October 1998.<br />
“Reclamation and Re-vegetation” Coal Mine Drainage Prediction and Pollution Prevention in<br />
Pennsylvania.<br />
Tillia, Ann M, <strong>Utah</strong> Department <strong>of</strong> Environmental <strong>Quality</strong>. <strong>Division</strong> <strong>of</strong> Environmental<br />
Response and Remediation, September 25, 2002. .Innovative Assessment Analytical Results<br />
Report Lower <strong>Silver</strong> <strong>Creek</strong>.<br />
United States Environmental Protection Agency, April 2001. 2001 Update <strong>of</strong> Ambient <strong>Water</strong><br />
<strong>Quality</strong> Criteria for Cadmium. EPA-822-R-01-001<br />
United States Environmental Protection Agency, May 4, 2001. Data Interpretation Report<br />
Upper <strong>Silver</strong> <strong>Creek</strong> <strong>Water</strong>shed Surface <strong>Water</strong>/Stream Sediment Monitoring 2000.<br />
United States Environmental Protection Agency internet website.<br />
http://www.epa.<strong>gov</strong>/owow/tmdl<br />
<strong>Utah</strong> Department <strong>of</strong> Environmental <strong>Quality</strong>, <strong>Division</strong> <strong>of</strong> <strong>Water</strong> <strong>Quality</strong>. <strong>Utah</strong> Administrative<br />
Code Rule R317-2. Standards <strong>of</strong> <strong>Quality</strong> for <strong>Water</strong>s <strong>of</strong> the State. January 6, 2004<br />
Page 64
<strong>Silver</strong> <strong>Creek</strong> <strong>Water</strong>shed TMDL Final Report<br />
<strong>Utah</strong> Department <strong>of</strong> Environmental <strong>Quality</strong>, <strong>Division</strong> <strong>of</strong> <strong>Water</strong> <strong>Quality</strong> internet website.<br />
http://waterquality.utah.<strong>gov</strong><br />
Page 65
<strong>Silver</strong> <strong>Creek</strong> <strong>Water</strong>shed TMDL Final Report<br />
Appendix A<br />
<strong>Silver</strong> <strong>Creek</strong> <strong>Water</strong> <strong>Quality</strong> Data<br />
Page 66
Station Site Description Date Cadmium (mg/l) Zinc (mg/l) Flow (cfs)<br />
1001 USC-1, Rail Tressel @ U248 5/15/2000 0.000 0.410 5.2<br />
1001 USC-1, Rail Tressel @ U248 9/27/2000 0.000 0.720 1.9<br />
1001 USC-1, Rail Tressel @ U248 11/7/2000 0.000 1.000 0.8<br />
1002 USC-2, Culvert @ U248 5/15/2000 0.000 0.330<br />
1002 USC-2, Culvert @ U248 9/27/2000 0.000 0.710<br />
1003 USC-3, Upstream RR Tressel 5/15/2000 0.001 0.510 3.3<br />
1003 USC-3, Upstream RR Tressel 9/27/2000 0.000 1.100 1.7<br />
1004 USC-32, Duplicate <strong>of</strong> USC-3 5/15/2000 0.001 0.520<br />
1005 USC-4, Diversion Ditch 50' 5/15/2000 0.000 0.000 0.1<br />
1005 USC-4, Diversion Ditch 50' 9/27/2000 0.000 0.055 0.1<br />
1005 USC-4, Diversion Ditch 50' 11/7/2000 0.000 0.100 0.1<br />
1006 USC-5, N. Old Road to R.F. 5/15/2000 0.001 0.950<br />
1006 USC-5, N. Old Road to R.F. 9/27/2000 0.000 2.000<br />
1007 USC-6, Below <strong>Silver</strong>maple 5/15/2000 0.000<br />
1007 USC-6, Below <strong>Silver</strong>maple 9/27/2000 0.000 0.640<br />
1007 USC-6, Below <strong>Silver</strong>maple 11/7/2000 0.000 1.400<br />
1008 USC-7, Above <strong>Silver</strong>maple<br />
5/15/2000 0.000 0.092 1.0<br />
1008 USC-7, Above <strong>Silver</strong>maple<br />
9/27/2000 0.000 0.460 0.1<br />
1008 USC-7, Above <strong>Silver</strong>maple 11/7/2000 0.007<br />
1009 USC-8, State Sample Site 5/15/2000 0.002 0.270 1.6<br />
1009 USC-8, State Sample Site<br />
9/27/2000 0.000 0.067 0.4<br />
1009 USC-8, State Sample Site 11/7/2000 0.005 0.360<br />
1010 USC-9, DV @ Confluence 5/16/2000 0.021 1.100 1.5<br />
1010 USC-9, DV @ Confluence<br />
9/27/2000 0.000 0.037 0.7<br />
1011 USC-10, DV E. <strong>of</strong> Rd. Going S. 5/16/2000 0.000 0.120 1.8<br />
1011 USC-10, DV E. <strong>of</strong> Rd. Going S. 9/27/2000 0.000 0.056 0.4<br />
1012 USC-11, Emp.Cyn. @ culvert<br />
5/16/2000 0.000 0.100<br />
1013 USC-12, Ont. Cyn. Merge w/Emp. 5/16/2000 0.001<br />
1014 USC-13, Emp. Cyn. @ flow drain 5/16/2000 0.044<br />
1015 USC-14, Flume Lower Ont. Cyn. 5/16/2000 0.009<br />
1016 USC-15, Flume Emp. Cyn. Iron Gate 5/16/2000 0.029<br />
2.100<br />
0.600 0.1<br />
5.300 0.0<br />
0.590 0.1<br />
4.400 0.1
<strong>Silver</strong> <strong>Creek</strong> <strong>Water</strong>shed TMDL Final Report<br />
1017 USC-17, Abv. Flume adj. Jude Tunnel<br />
5/16/2000 0.000 0.011 0.0<br />
1018 USC-25, Woodside Gulch 5/16/2000 0.000 0.040<br />
1019 USC-JT, Judge Tnl. Up. Daly#1 Shaft 5/16/2000 0.002 0.730<br />
1020 Empire 1, Upper Empire Canyon<br />
5/16/2000 0.000 0.078<br />
1021 Ruby 1, Ruby Chairlift 5/16/2000 0.000 0.049<br />
1022 Ruby 2, Gulch North <strong>of</strong> Daly West 5/16/2000 0.002 0.130<br />
1023 USC-RC, Resort Center 5/22/2000 0.000 0.055<br />
1024 LBA, LittleBell Above 5/31/2000 0.000 0.027<br />
1025 LBB, LittleBell Below 5/31/2000 0.000 0.065<br />
1026 GET, Great East Tunnel 5/31/2000 0.000 0.053<br />
1027 TC-1, T. Cyn. Next to shaft dump 6/5/2000 0.036<br />
1028 CT-1, Comstock Tunnel 6/5/2000 0.008 1.700<br />
1029 USC-7, State Split 9/27/2000 0.000 0.406<br />
1030 USC-30 9/27/2000 0.000 0.640<br />
1031 Iron Horse 1 9/27/2000 0.000 0.065<br />
1032 Iron Horse 2 9/27/2000 0.000 0.059<br />
1033 Bonanza Dr. 9/27/2000 0.000 0.067<br />
1034 Ross 1 9/28/2000 0.000 0.033<br />
1035 DV-3 9/28/2000 0.000 0.045<br />
3001 <strong>Silver</strong> <strong>Creek</strong> Above Richardson Flats - USGS 2000 3/14/2000 0.002<br />
3001 <strong>Silver</strong> <strong>Creek</strong> Above Richardson Flats - USGS 2000 4/24/2000 0.003 1.650<br />
3001 <strong>Silver</strong> <strong>Creek</strong> Above Richardson Flats - USGS 2000 5/16/2000 0.000 0.550<br />
3001 <strong>Silver</strong> <strong>Creek</strong> Above Richardson Flats - USGS 2000 6/12/2000 0.002<br />
3001 <strong>Silver</strong> <strong>Creek</strong> Above Richardson Flats - USGS 2000 8/16/2000 0.001<br />
3002 <strong>Silver</strong> <strong>Creek</strong> At Atkinson - USGS 2000 3/10/2000 0.002 1.170<br />
3002 <strong>Silver</strong> <strong>Creek</strong> At Atkinson - USGS 2000 8/16/2000 0.000 0.100<br />
3003 <strong>Silver</strong> <strong>Creek</strong> At Wanship - USGS 2000 3/13/2000 0.002 0.570<br />
3003 <strong>Silver</strong> <strong>Creek</strong> At Wanship - USGS 2000 8/21/2000 0.000 0.160<br />
3004 <strong>Silver</strong> <strong>Creek</strong> At Bonanza Dr. - USGS 2000 3/10/2000 0.004 0.250<br />
3004 <strong>Silver</strong> <strong>Creek</strong> At Bonanza Dr. - USGS 2000 8/16/2000 0.000 0.090<br />
4001 SCS-5000 <strong>Silver</strong> <strong>Creek</strong> Above Richardson Flats - USGS 2002 5/1/2002 0.729 5.8<br />
4002 SCS-5500 <strong>Silver</strong> <strong>Creek</strong> Below Richardson Flats - USGS 2002 5/1/2002 0.694 8.3<br />
2.900<br />
0.970<br />
0.760<br />
1.800<br />
Page 68
<strong>Silver</strong> <strong>Creek</strong> <strong>Water</strong>shed TMDL Final Report<br />
4003 SCS-6000 <strong>Silver</strong> <strong>Creek</strong> Above <strong>Silver</strong> <strong>Creek</strong> WWTP - USGS 2002 5/1/2002 3.520<br />
4004 SCS-6500 <strong>Silver</strong> <strong>Creek</strong> At Atkinson (Below WWTP) - USGS 2002 5/1/2002 1.630<br />
4005 SCS-7000 <strong>Silver</strong> <strong>Creek</strong> @ Wanship - USGS 2002 5/1/2002 0.243<br />
492674 SILVER CK AT FARM XING IN ATKINSON 1/22/1991 3.7<br />
492674 SILVER CK AT FARM XING IN ATKINSON 7/3/1991 0.5<br />
492674 SILVER CK AT FARM XING IN ATKINSON 10/30/1991<br />
492674 SILVER CK AT FARM XING IN ATKINSON 1/22/1992 2.3<br />
492674 SILVER CK AT FARM XING IN ATKINSON 4/15/1993 8.2<br />
492674 SILVER CK AT FARM XING IN ATKINSON 4/28/1993 8.5<br />
492674 SILVER CK AT FARM XING IN ATKINSON 5/11/1993 32.8<br />
492674 SILVER CK AT FARM XING IN ATKINSON 5/27/1993 21.4<br />
492674 SILVER CK AT FARM XING IN ATKINSON 7/20/1993 1.0<br />
492674 SILVER CK AT FARM XING IN ATKINSON 10/27/1993 4.8<br />
492674 SILVER CK AT FARM XING IN ATKINSON 2/17/1994 3.0<br />
492674 SILVER CK AT FARM XING IN ATKINSON 4/19/1994 3.5<br />
492674 SILVER CK AT FARM XING IN ATKINSON 6/14/1994 7.0<br />
492674 SILVER CK AT FARM XING IN ATKINSON 8/9/1994 1.7<br />
492674 SILVER CK AT FARM XING IN ATKINSON 11/15/1994 3.8<br />
492674 SILVER CK AT FARM XING IN ATKINSON 1/12/1995 1.8<br />
492674 SILVER CK AT FARM XING IN ATKINSON 4/6/1995 4.8<br />
492674 SILVER CK AT FARM XING IN ATKINSON 8/15/1995 3.5<br />
492674 SILVER CK AT FARM XING IN ATKINSON 11/21/1995 7.0<br />
492674 SILVER CK AT FARM XING IN ATKINSON 2/1/1996 0.004 1.500 5.0<br />
492674 SILVER CK AT FARM XING IN ATKINSON 6/13/1996 0.000 0.260 2.5<br />
492674 SILVER CK AT FARM XING IN ATKINSON 8/1/1996 0.000 0.240 3.0<br />
492674 SILVER CK AT FARM XING IN ATKINSON 10/22/1996 0.001<br />
492674 SILVER CK AT FARM XING IN ATKINSON 2/4/1997 0.006<br />
0.620 5.4<br />
1.800 7.0<br />
492674 SILVER CK AT FARM XING IN ATKINSON 5/14/1997 0.006 1.100 18.0<br />
492674 SILVER CK AT FARM XING IN ATKINSON 8/6/1997 0.000 0.074 9.0<br />
492674 SILVER CK AT FARM XING IN ATKINSON 10/21/1997 0.000 0.500 6.0<br />
492674 SILVER CK AT FARM XING IN ATKINSON 1/29/1998 0.001<br />
1.0<br />
4.2<br />
19.0<br />
1.000 2.0<br />
Page 69
<strong>Silver</strong> <strong>Creek</strong> <strong>Water</strong>shed TMDL Final Report<br />
492674 SILVER CK AT FARM XING IN ATKINSON 4/14/1998 0.003 1.100 4.0<br />
492674 SILVER CK AT FARM XING IN ATKINSON 7/23/1998 0.000 0.260 3.4<br />
492674 SILVER CK AT FARM XING IN ATKINSON 10/29/1998 0.001<br />
0.570 4.0<br />
492674 SILVER CK AT FARM XING IN ATKINSON 1/22/1999 0.002 0.990 9.0<br />
492674 SILVER CK AT FARM XING IN ATKINSON 4/14/1999 0.000 0.570 5.6<br />
492674 SILVER CK AT FARM XING IN ATKINSON 11/3/1999 0.000 0.370 4.5<br />
492674 SILVER CK AT FARM XING IN ATKINSON 1/6/2000 0.000 0.500 3.5<br />
492674 SILVER CK AT FARM XING IN ATKINSON 4/13/2000 0.000 0.387 4.5<br />
492674 SILVER CK AT FARM XING IN ATKINSON 8/24/2000 0.000 0.173 3.0<br />
492674 SILVER CK AT FARM XING IN ATKINSON 11/1/2000 0.004<br />
492674 SILVER CK AT FARM XING IN ATKINSON 1/30/2001 0.003<br />
2.720 9.8<br />
1.630 3.5<br />
492674 SILVER CK AT FARM XING IN ATKINSON 5/16/2001 0.003 1.260 13.4<br />
492674 SILVER CK AT FARM XING IN ATKINSON 7/20/2001 0.000 0.129 0.5<br />
492674 SILVER CK AT FARM XING IN ATKINSON 8/1/2001 0.000 0.073 2.4<br />
492674 SILVER CK AT FARM XING IN ATKINSON 9/6/2001 0.000 0.093 2.9<br />
492674 SILVER CK AT FARM XING IN ATKINSON 10/4/2001 0.000 0.135 7.7<br />
492674 SILVER CK AT FARM XING IN ATKINSON 11/8/2001 0.001<br />
492674 SILVER CK AT FARM XING IN ATKINSON 12/11/2001 0.005<br />
492674 SILVER CK AT FARM XING IN ATKINSON 1/9/2002 0.005<br />
492674 SILVER CK AT FARM XING IN ATKINSON 2/5/2002 0.004<br />
492674 SILVER CK AT FARM XING IN ATKINSON 3/21/2002 0.005<br />
492674 SILVER CK AT FARM XING IN ATKINSON 4/11/2002 0.005<br />
492674 SILVER CK AT FARM XING IN ATKINSON 5/16/2002 0.002<br />
0.849 6.0<br />
2.420 3.8<br />
1.470 4.5<br />
1.760 3.0<br />
1.880 9.5<br />
492674 SILVER CK AT FARM XING IN ATKINSON 8/13/2002 3.1<br />
492675 SILVER CK AT WANSHIP AB CNFL / WEBER R 1/17/1990 5.6<br />
492675 SILVER CK AT WANSHIP AB CNFL / WEBER R 2/15/1990 3.6<br />
492675 SILVER CK AT WANSHIP AB CNFL / WEBER R 4/5/1990 8.6<br />
492675 SILVER CK AT WANSHIP AB CNFL / WEBER R 5/17/1990 7.3<br />
492675 SILVER CK AT WANSHIP AB CNFL / WEBER R 6/19/1990 3.3<br />
492675 SILVER CK AT WANSHIP AB CNFL / WEBER R 9/6/1990 2.7<br />
492675 SILVER CK AT WANSHIP AB CNFL / WEBER R 10/10/1990 2.0<br />
492675 SILVER CK AT WANSHIP AB CNFL / WEBER R 12/11/1990 4.3<br />
1.430<br />
0.491<br />
Page 70
<strong>Silver</strong> <strong>Creek</strong> <strong>Water</strong>shed TMDL Final Report<br />
492675 SILVER CK AT WANSHIP AB CNFL / WEBER R 2/20/1991 11.5<br />
492675 SILVER CK AT WANSHIP AB CNFL / WEBER R 5/8/1991 26.0<br />
492675 SILVER CK AT WANSHIP AB CNFL / WEBER R 6/27/1991 4.8<br />
492675 SILVER CK AT WANSHIP AB CNFL / WEBER R 8/8/1991 3.2<br />
492675 SILVER CK AT WANSHIP AB CNFL / WEBER R 10/8/1991 4.5<br />
492675 SILVER CK AT WANSHIP AB CNFL / WEBER R 11/26/1991 9.4<br />
492675 SILVER CK AT WANSHIP AB CNFL / WEBER R 1/30/1992 4.3<br />
492675 SILVER CK AT WANSHIP AB CNFL / WEBER R 3/18/1992 6.2<br />
492675 SILVER CK AT WANSHIP AB CNFL / WEBER R 4/21/1992 4.3<br />
492675 SILVER CK AT WANSHIP AB CNFL / WEBER R 6/24/1992 0.000 0.150 1.7<br />
492675 SILVER CK AT WANSHIP AB CNFL / WEBER R 8/6/1992 0.001 0.240<br />
492675 SILVER CK AT WANSHIP AB CNFL / WEBER R 9/24/1992 0.002 0.220 1.8<br />
492675 SILVER CK AT WANSHIP AB CNFL / WEBER R 11/5/1992 0.000 0.500 5.3<br />
492675 SILVER CK AT WANSHIP AB CNFL / WEBER R 1/21/1993 0.000 0.720 3.8<br />
492675 SILVER CK AT WANSHIP AB CNFL / WEBER R 4/1/1993 0.005<br />
492675 SILVER CK AT WANSHIP AB CNFL / WEBER R 4/15/1993 0.003<br />
1.2<br />
1.700 38.0<br />
1.400 6.9<br />
492675 SILVER CK AT WANSHIP AB CNFL / WEBER R 4/29/1993 26.7<br />
492675 SILVER CK AT WANSHIP AB CNFL / WEBER R 5/11/1993 22.0<br />
492675 SILVER CK AT WANSHIP AB CNFL / WEBER R 5/27/1993 7.0<br />
492675 SILVER CK AT WANSHIP AB CNFL / WEBER R 6/9/1993 5.8<br />
492675 SILVER CK AT WANSHIP AB CNFL / WEBER R 7/20/1993 0.002 0.300<br />
492675 SILVER CK AT WANSHIP AB CNFL / WEBER R 8/24/1993 6.2<br />
492675 SILVER CK AT WANSHIP AB CNFL / WEBER R 9/23/1993 4.9<br />
492675 SILVER CK AT WANSHIP AB CNFL / WEBER R 10/27/1993 8.3<br />
492675 SILVER CK AT WANSHIP AB CNFL / WEBER R 11/23/1993 0.001<br />
492675 SILVER CK AT WANSHIP AB CNFL / WEBER R 1/12/1994 0.001<br />
492675 SILVER CK AT WANSHIP AB CNFL / WEBER R 2/17/1994 0.001<br />
3.3<br />
0.550 3.7<br />
0.580 2.9<br />
0.730 4.4<br />
492675 SILVER CK AT WANSHIP AB CNFL / WEBER R 3/23/1994 14.0<br />
492675 SILVER CK AT WANSHIP AB CNFL / WEBER R 4/5/1994 0.000 0.490 13.0<br />
492675 SILVER CK AT WANSHIP AB CNFL / WEBER R 4/20/1994 11.0<br />
492675 SILVER CK AT WANSHIP AB CNFL / WEBER R 5/3/1994 14.0<br />
Page 71
<strong>Silver</strong> <strong>Creek</strong> <strong>Water</strong>shed TMDL Final Report<br />
492675 SILVER CK AT WANSHIP AB CNFL / WEBER R 5/17/1994 10.0<br />
492675 SILVER CK AT WANSHIP AB CNFL / WEBER R 6/2/1994 4.7<br />
492675 SILVER CK AT WANSHIP AB CNFL / WEBER R 6/14/1994 2.2<br />
492675 SILVER CK AT WANSHIP AB CNFL / WEBER R 7/22/1998 0.001 0.156<br />
492675 SILVER CK AT WANSHIP AB CNFL / WEBER R 8/27/1998 10.0<br />
492675 SILVER CK AT WANSHIP AB CNFL / WEBER R 10/1/1998 4.0<br />
492675 SILVER CK AT WANSHIP AB CNFL / WEBER R 10/29/1998 0.000 0.200 5.0<br />
492675 SILVER CK AT WANSHIP AB CNFL / WEBER R 12/17/1998 10.0<br />
492675 SILVER CK AT WANSHIP AB CNFL / WEBER R 1/21/1999 0.000 0.240 5.0<br />
492675 SILVER CK AT WANSHIP AB CNFL / WEBER R 2/18/1999 6.0<br />
492675 SILVER CK AT WANSHIP AB CNFL / WEBER R 3/26/1999 29.9<br />
492675 SILVER CK AT WANSHIP AB CNFL / WEBER R 4/16/1999 0.000 0.150 8.0<br />
492675 SILVER CK AT WANSHIP AB CNFL / WEBER R 4/29/1999 75.6<br />
492675 SILVER CK AT WANSHIP AB CNFL / WEBER R 5/14/1999 86.9<br />
492675 SILVER CK AT WANSHIP AB CNFL / WEBER R 6/3/1999 59.3<br />
492675 SILVER CK AT WANSHIP AB CNFL / WEBER R 6/17/1999 12.0<br />
492675 SILVER CK AT WANSHIP AB CNFL / WEBER R 8/1/2001 0.001 0.147 4.3<br />
492675 SILVER CK AT WANSHIP AB CNFL / WEBER R 9/6/2001 0.000 0.109 3.0<br />
492675 SILVER CK AT WANSHIP AB CNFL / WEBER R 10/4/2001 0.000 0.102 3.5<br />
492675 SILVER CK AT WANSHIP AB CNFL / WEBER R 11/6/2001 0.000 0.123 4.0<br />
492675 SILVER CK AT WANSHIP AB CNFL / WEBER R 12/11/2001 0.001 0.712 4.2<br />
492675 SILVER CK AT WANSHIP AB CNFL / WEBER R 1/9/2002 0.000 0.508 17.6<br />
492675 SILVER CK AT WANSHIP AB CNFL / WEBER R 2/5/2002 0.000 0.820<br />
492675 SILVER CK AT WANSHIP AB CNFL / WEBER R 3/21/2002 0.001 0.537 13.9<br />
492675 SILVER CK AT WANSHIP AB CNFL / WEBER R 4/11/2002 0.000 0.383 20.6<br />
492675 SILVER CK AT WANSHIP AB CNFL / WEBER R 4/25/2002 0.000 0.262<br />
492675 SILVER CK AT WANSHIP AB CNFL / WEBER R 5/16/2002 0.000 0.058 11.5<br />
492679 SILVER CREEK WWTP 1/18/1990 1.5<br />
492679 SILVER CREEK WWTP 1/25/1990<br />
492679 SILVER CREEK WWTP 4/5/1990 1.4<br />
492679 SILVER CREEK WWTP 5/17/1990 0.9<br />
492679 SILVER CREEK WWTP 6/19/1990 1.2<br />
5.0<br />
Page 72
<strong>Silver</strong> <strong>Creek</strong> <strong>Water</strong>shed TMDL Final Report<br />
492679 SILVER CREEK WWTP 9/6/1990 2.0<br />
492679 SILVER CREEK WWTP 10/10/1990 0.5<br />
492679 SILVER CREEK WWTP 12/11/1990 0.6<br />
492679 SILVER CREEK WWTP 1/22/1991 1.6<br />
492679 SILVER CREEK WWTP 2/20/1991 2.1<br />
492679 SILVER CREEK WWTP 5/8/1991 1.1<br />
492679 SILVER CREEK WWTP 7/3/1991 1.7<br />
492679 SILVER CREEK WWTP 8/8/1991 1.5<br />
492679 SILVER CREEK WWTP 10/8/1991 1.4<br />
492679 SILVER CREEK WWTP 10/30/1991<br />
492679 SILVER CREEK WWTP 11/26/1991 1.3<br />
492679 SILVER CREEK WWTP 1/22/1992<br />
492679 SILVER CREEK WWTP 1/30/1992 1.5<br />
492679 SILVER CREEK WWTP 3/18/1992 2.5<br />
492679 SILVER CREEK WWTP 4/21/1992 1.2<br />
492679 SILVER CREEK WWTP 6/24/1992 1.8<br />
492679 SILVER CREEK WWTP 8/6/1992 2.5<br />
492679 SILVER CREEK WWTP 9/24/1992 2.2<br />
492679 SILVER CREEK WWTP 11/5/1992 1.5<br />
492679 SILVER CREEK WWTP 1/21/1993 1.9<br />
492679 SILVER CREEK WWTP 4/1/1993 4.0<br />
492679 SILVER CREEK WWTP 4/15/1993 2.6<br />
492679 SILVER CREEK WWTP 4/28/1993 2.6<br />
492679 SILVER CREEK WWTP 5/11/1993 2.5<br />
492679 SILVER CREEK WWTP 5/27/1993 2.2<br />
492679 SILVER CREEK WWTP 6/9/1993 0.0<br />
492679 SILVER CREEK WWTP 7/20/1993 2.0<br />
492679 SILVER CREEK WWTP 8/24/1993 2.6<br />
492679 SILVER CREEK WWTP 9/22/1993 2.0<br />
492679 SILVER CREEK WWTP 10/27/1993 1.7<br />
492679 SILVER CREEK WWTP 11/23/1993 1.2<br />
Page 73
<strong>Silver</strong> <strong>Creek</strong> <strong>Water</strong>shed TMDL Final Report<br />
492679 SILVER CREEK WWTP 1/12/1994 2.0<br />
492679 SILVER CREEK WWTP 2/17/1994 1.9<br />
492679 SILVER CREEK WWTP 4/19/1994 1.9<br />
492679 SILVER CREEK WWTP 6/14/1994 1.5<br />
492679 SILVER CREEK WWTP 8/9/1994 2.6<br />
492679 SILVER CREEK WWTP 9/20/1994 0.8<br />
492679 SILVER CREEK WWTP 11/15/1994 1.2<br />
492679 SILVER CREEK WWTP 1/12/1995 2.9<br />
492679 SILVER CREEK WWTP 2/15/1995 2.1<br />
492679 SILVER CREEK WWTP 4/6/1995 2.5<br />
492679 SILVER CREEK WWTP 5/16/1995 2.7<br />
492679 SILVER CREEK WWTP 8/15/1995 2.2<br />
492679 SILVER CREEK WWTP 9/28/1995 1.5<br />
492679 SILVER CREEK WWTP 11/21/1995 2.8<br />
492679 SILVER CREEK WWTP 2/1/1996 2.6<br />
492679 SILVER CREEK WWTP 3/6/1996 4.0<br />
492679 SILVER CREEK WWTP 4/17/1996 2.8<br />
492679 SILVER CREEK WWTP 6/13/1996 2.8<br />
492679 SILVER CREEK WWTP 8/1/1996 1.7<br />
492679 SILVER CREEK WWTP 9/12/1996 1.2<br />
492679 SILVER CREEK WWTP 10/22/1996 1.1<br />
492679 SILVER CREEK WWTP 12/4/1996 1.4<br />
492679 SILVER CREEK WWTP 2/4/1997 2.2<br />
492679 SILVER CREEK WWTP 3/25/1997 2.3<br />
492679 SILVER CREEK WWTP 7/10/1997 1.7<br />
492679 SILVER CREEK WWTP 8/6/1997 1.9<br />
492679 SILVER CREEK WWTP 9/25/1997 1.3<br />
492679 SILVER CREEK WWTP 10/21/1997 2.0<br />
492679 SILVER CREEK WWTP 12/11/1997 1.2<br />
492679 SILVER CREEK WWTP 1/29/1998 0.000 0.110 2.3<br />
492679 SILVER CREEK WWTP 3/5/1998 2.2<br />
Page 74
<strong>Silver</strong> <strong>Creek</strong> <strong>Water</strong>shed TMDL Final Report<br />
492679 SILVER CREEK WWTP 4/14/1998 0.000 0.330 2.9<br />
492679 SILVER CREEK WWTP 7/23/1998 0.000 0.136 2.3<br />
492679 SILVER CREEK WWTP 8/27/1998 4.8<br />
492679 SILVER CREEK WWTP 10/1/1998 2.0<br />
492679 SILVER CREEK WWTP 10/29/1998 2.4<br />
492679 SILVER CREEK WWTP 12/17/1998 1.5<br />
492679 SILVER CREEK WWTP 1/22/1999 1.7<br />
492679 SILVER CREEK WWTP 2/18/1999 3.1<br />
492679 SILVER CREEK WWTP 4/14/1999 0.000 0.150 1.7<br />
492679 SILVER CREEK WWTP 4/29/1999 2.4<br />
492679 SILVER CREEK WWTP 5/14/1999 2.2<br />
492679 SILVER CREEK WWTP 6/3/1999 1.9<br />
492679 SILVER CREEK WWTP 6/17/1999 2.0<br />
492679 SILVER CREEK WWTP 11/3/1999<br />
492679 SILVER CREEK WWTP 1/6/2000 2.5<br />
492679 SILVER CREEK WWTP 2/24/2000 2.5<br />
492679 SILVER CREEK WWTP 4/13/2000 2.1<br />
492679 SILVER CREEK WWTP 6/13/2000 0.6<br />
492679 SILVER CREEK WWTP 8/24/2000 1.1<br />
492679 SILVER CREEK WWTP 9/26/2000 1.1<br />
492679 SILVER CREEK WWTP 11/1/2000 1.4<br />
492679 SILVER CREEK WWTP 1/30/2001 3.0<br />
492679 SILVER CREEK WWTP 5/16/2001 2.8<br />
492679 SILVER CREEK WWTP 7/20/2001 2.7<br />
492679 SILVER CREEK WWTP 8/1/2001 0.000 0.099 1.5<br />
492679 SILVER CREEK WWTP 9/6/2001 0.000 0.097 2.6<br />
492679 SILVER CREEK WWTP 10/4/2001 0.000 0.101 2.2<br />
492679 SILVER CREEK WWTP 11/8/2001 0.000 0.120 1.8<br />
492679 SILVER CREEK WWTP 12/11/2001 0.000 0.089 2.8<br />
492679 SILVER CREEK WWTP 1/9/2002 0.000 0.085 2.6<br />
492679 SILVER CREEK WWTP 2/5/2002 0.000 0.083 2.9<br />
492679 SILVER CREEK WWTP 2/20/2002 4.6<br />
Page 75
<strong>Silver</strong> <strong>Creek</strong> <strong>Water</strong>shed TMDL Final Report<br />
492679 SILVER CREEK WWTP 3/21/2002 3.2<br />
492679 SILVER CREEK WWTP 4/11/2002 0.000 0.187 3.2<br />
492679 SILVER CREEK WWTP 4/25/2002 0.000 0.194<br />
492679 SILVER CREEK WWTP 5/16/2002 2.2<br />
492679 SILVER CREEK WWTP 6/26/2002 2.6<br />
492679 SILVER CREEK WWTP 8/13/2002 3.1<br />
492680 SILVER CK AB ATKINSON 1/25/1990<br />
492680 SILVER CK AB ATKINSON 4/5/1990 1.6<br />
492680 SILVER CK AB ATKINSON 5/17/1990 4.0<br />
492680 SILVER CK AB ATKINSON 6/19/1990 1.4<br />
492680 SILVER CK AB ATKINSON 9/6/1990 0.0<br />
492680 SILVER CK AB ATKINSON 10/10/1990 4.4<br />
492680 SILVER CK AB ATKINSON 12/11/1990 1.8<br />
492680 SILVER CK AB ATKINSON 2/20/1991 8.3<br />
492680 SILVER CK AB ATKINSON 5/8/1991 3.0<br />
492680 SILVER CK AB ATKINSON 8/8/1991<br />
492680 SILVER CK AB ATKINSON 10/8/1991 5.0<br />
492680 SILVER CK AB ATKINSON 7/23/1998 1.0<br />
492680 SILVER CK AB ATKINSON 10/29/1998 0.000 0.087 0.4<br />
492680 SILVER CK AB ATKINSON 4/14/1999 0.001 0.600 3.9<br />
492680 SILVER CK AB ATKINSON 11/3/1999 0.000 0.300 1.8<br />
492680 SILVER CK AB ATKINSON 1/6/2000 0.000 0.670<br />
492680 SILVER CK AB ATKINSON 4/13/2000 0.000 0.765 1.3<br />
492680 SILVER CK AB ATKINSON 8/24/2000 0.000 0.568 1.5<br />
492680 SILVER CK AB ATKINSON 11/1/2000 0.008<br />
492680 SILVER CK AB ATKINSON 1/30/2001 0.001<br />
492680 SILVER CK AB ATKINSON 5/16/2001 0.003<br />
3.630 4.7<br />
0.694<br />
1.100 10.4<br />
492680 SILVER CK AB ATKINSON 8/1/2001 0.0<br />
492680 SILVER CK AB ATKINSON 9/6/2001 0.000 0.054 0.3<br />
492680 SILVER CK AB ATKINSON 10/4/2001 0.000 0.000 0.2<br />
492680 SILVER CK AB ATKINSON 11/8/2001 0.008<br />
492680 SILVER CK AB ATKINSON 12/11/2001 0.019<br />
2.320 4.2<br />
6.350 1.8<br />
Page 76
492680 SILVER CK AB ATKINSON 1/9/2002 0.011<br />
492680 SILVER CK AB ATKINSON 2/5/2002 0.019<br />
492680 SILVER CK AB ATKINSON 3/21/2002 0.007<br />
492680 SILVER CK AB ATKINSON 4/11/2002 0.010<br />
492680 SILVER CK AB ATKINSON 5/16/2002 0.004<br />
<strong>Silver</strong> <strong>Creek</strong> <strong>Water</strong>shed TMDL Final Report<br />
2.880 2.5<br />
7.340 1.0<br />
2.970 0.9<br />
2.580 4.0<br />
0.808 2.0<br />
492680 SILVER CK AB ATKINSON 8/13/2002 0.0<br />
492685 SILVER CK AT US40 XING E OF PARK CITY 7/3/1991<br />
492685 SILVER CK AT US40 XING E OF PARK CITY 10/30/1991<br />
492685 SILVER CK AT US40 XING E OF PARK CITY 11/26/1991 4.0<br />
492685 SILVER CK AT US40 XING E OF PARK CITY 1/30/1992<br />
492685 SILVER CK AT US40 XING E OF PARK CITY 3/18/1992 1.9<br />
492685 SILVER CK AT US40 XING E OF PARK CITY 4/21/1992 3.5<br />
492685 SILVER CK AT US40 XING E OF PARK CITY 6/24/1992 0.000 0.069 0.3<br />
492685 SILVER CK AT US40 XING E OF PARK CITY 8/6/1992 0.000 0.330 0.3<br />
492685 SILVER CK AT US40 XING E OF PARK CITY 9/24/1992 0.001<br />
492685 SILVER CK AT US40 XING E OF PARK CITY 11/5/1992 0.002<br />
492685 SILVER CK AT US40 XING E OF PARK CITY 1/21/1993 0.002<br />
492685 SILVER CK AT US40 XING E OF PARK CITY 4/8/1993 0.010<br />
492685 SILVER CK AT US40 XING E OF PARK CITY 4/15/1993 0.006<br />
0.540 0.3<br />
1.400 2.1<br />
1.200<br />
2.600 9.5<br />
1.400 4.9<br />
492685 SILVER CK AT US40 XING E OF PARK CITY 4/28/1993 7.0<br />
492685 SILVER CK AT US40 XING E OF PARK CITY 5/11/1993 18.0<br />
492685 SILVER CK AT US40 XING E OF PARK CITY 5/27/1993 19.4<br />
492685 SILVER CK AT US40 XING E OF PARK CITY 6/9/1993 16.7<br />
492685 SILVER CK AT US40 XING E OF PARK CITY 7/20/1993 0.002<br />
0.700 3.9<br />
492685 SILVER CK AT US40 XING E OF PARK CITY 8/24/1993 3.0<br />
492685 SILVER CK AT US40 XING E OF PARK CITY 9/22/1993 3.4<br />
492685 SILVER CK AT US40 XING E OF PARK CITY 10/27/1993 0.004<br />
492685 SILVER CK AT US40 XING E OF PARK CITY 11/23/1993 0.003<br />
492685 SILVER CK AT US40 XING E OF PARK CITY 1/12/1994 0.004<br />
492685 SILVER CK AT US40 XING E OF PARK CITY 2/17/1994 0.002<br />
1.200 2.5<br />
1.100 1.2<br />
1.200<br />
0.960 2.0<br />
492685 SILVER CK AT US40 XING E OF PARK CITY 3/23/1994 8.5<br />
Page 77
492685 SILVER CK AT US40 XING E OF PARK CITY 4/5/1994 0.002<br />
<strong>Silver</strong> <strong>Creek</strong> <strong>Water</strong>shed TMDL Final Report<br />
1.300 3.5<br />
492685 SILVER CK AT US40 XING E OF PARK CITY 4/19/1994 4.5<br />
492685 SILVER CK AT US40 XING E OF PARK CITY 5/3/1994 9.0<br />
492685 SILVER CK AT US40 XING E OF PARK CITY 5/17/1994 2.0<br />
492685 SILVER CK AT US40 XING E OF PARK CITY 6/2/1994 7.6<br />
492685 SILVER CK AT US40 XING E OF PARK CITY 6/14/1994 2.0<br />
492685 SILVER CK AT US40 XING E OF PARK CITY 8/9/1994 1.8<br />
492685 SILVER CK AT US40 XING E OF PARK CITY 11/15/1994 0.3<br />
492685 SILVER CK AT US40 XING E OF PARK CITY 1/12/1995 1.0<br />
492685 SILVER CK AT US40 XING E OF PARK CITY 4/6/1995 3.8<br />
492685 SILVER CK AT US40 XING E OF PARK CITY 8/15/1995 1.5<br />
492685 SILVER CK AT US40 XING E OF PARK CITY 11/21/1995 3.3<br />
492685 SILVER CK AT US40 XING E OF PARK CITY 1/24/1996 5.0<br />
492685 SILVER CK AT US40 XING E OF PARK CITY 6/13/1996 0.002<br />
0.670 2.0<br />
492685 SILVER CK AT US40 XING E OF PARK CITY 8/1/1996 0.002 0.610 2.5<br />
492685 SILVER CK AT US40 XING E OF PARK CITY 10/22/1996 0.000 0.350 1.8<br />
492685 SILVER CK AT US40 XING E OF PARK CITY 2/3/1997 0.003<br />
492685 SILVER CK AT US40 XING E OF PARK CITY 5/14/1997 0.002<br />
0.990 5.0<br />
0.620 12.0<br />
492685 SILVER CK AT US40 XING E OF PARK CITY 8/6/1997 0.0<br />
492685 SILVER CK AT US40 XING E OF PARK CITY 9/25/1997 0.000 0.270 3.0<br />
492685 SILVER CK AT US40 XING E OF PARK CITY 10/21/1997 0.000 0.490 3.5<br />
492685 SILVER CK AT US40 XING E OF PARK CITY 1/29/1998 0.0<br />
492685 SILVER CK AT US40 XING E OF PARK CITY 3/5/1998 0.003<br />
0.970 2.0<br />
492685 SILVER CK AT US40 XING E OF PARK CITY 4/14/1998 0.003 1.100 3.0<br />
492685 SILVER CK AT US40 XING E OF PARK CITY 7/23/1998 0.000 0.280 3.5<br />
492685 SILVER CK AT US40 XING E OF PARK CITY 8/27/1998 2.0<br />
492685 SILVER CK AT US40 XING E OF PARK CITY 10/1/1998 2.0<br />
492685 SILVER CK AT US40 XING E OF PARK CITY 10/29/1998 0.002<br />
0.810 1.5<br />
492685 SILVER CK AT US40 XING E OF PARK CITY 12/17/1998 2.0<br />
492685 SILVER CK AT US40 XING E OF PARK CITY 1/22/1999 0.002<br />
492685 SILVER CK AT US40 XING E OF PARK CITY 2/18/1999 0.003<br />
0.930<br />
0.880 1.0<br />
Page 78
<strong>Silver</strong> <strong>Creek</strong> <strong>Water</strong>shed TMDL Final Report<br />
492685 SILVER CK AT US40 XING E OF PARK CITY 3/26/1999 3.5<br />
492685 SILVER CK AT US40 XING E OF PARK CITY 4/14/1999 0.001<br />
0.400 1.0<br />
492685 SILVER CK AT US40 XING E OF PARK CITY 4/29/1999 7.5<br />
492685 SILVER CK AT US40 XING E OF PARK CITY 5/14/1999 0.002<br />
492685 SILVER CK AT US40 XING E OF PARK CITY 6/3/1999 15.0<br />
492685 SILVER CK AT US40 XING E OF PARK CITY 6/17/1999 0.000 0.260 3.5<br />
492685 SILVER CK AT US40 XING E OF PARK CITY 8/1/2001 0.0<br />
492685 SILVER CK AT US40 XING E OF PARK CITY 9/6/2001 0.000 0.175 0.3<br />
492685 SILVER CK AT US40 XING E OF PARK CITY 10/4/2001 0.000 0.224 0.4<br />
492685 SILVER CK AT US40 XING E OF PARK CITY 11/8/2001 0.002<br />
492685 SILVER CK AT US40 XING E OF PARK CITY 12/11/2001 0.003<br />
492685 SILVER CK AT US40 XING E OF PARK CITY 1/9/2002 0.002<br />
492685 SILVER CK AT US40 XING E OF PARK CITY 2/5/2002 0.001<br />
492685 SILVER CK AT US40 XING E OF PARK CITY 3/21/2002 0.001<br />
492685 SILVER CK AT US40 XING E OF PARK CITY 4/11/2002 0.004<br />
492685 SILVER CK AT US40 XING E OF PARK CITY 4/25/2002 0.001<br />
492685 SILVER CK AT US40 XING E OF PARK CITY 5/16/2002 0.001 0.351<br />
0.460<br />
0.952 0.2<br />
0.956 1.0<br />
0.686 0.5<br />
1.380 0.5<br />
0.735 0.8<br />
1.240 4.0<br />
492695 SILVER CK @ CITY PARK AB PROSPECTOR SQUARE 8/6/1997 0.0<br />
492695 SILVER CK @ CITY PARK AB PROSPECTOR SQUARE 9/25/1997 0.000 0.110 0.0<br />
492695 SILVER CK @ CITY PARK AB PROSPECTOR SQUARE 10/21/1997 0.005 0.690 1.2<br />
492695 SILVER CK @ CITY PARK AB PROSPECTOR SQUARE 12/11/1997 0.000 0.160 0.2<br />
492695 SILVER CK @ CITY PARK AB PROSPECTOR SQUARE 1/29/1998 0.001 0.230<br />
492695 SILVER CK @ CITY PARK AB PROSPECTOR SQUARE 4/14/1998 0.011<br />
492695 SILVER CK @ CITY PARK AB PROSPECTOR SQUARE 7/23/1998 0.006<br />
0.555<br />
2.0<br />
0.5<br />
0.980 1.0<br />
0.450 0.4<br />
492695 SILVER CK @ CITY PARK AB PROSPECTOR SQUARE 8/27/1998 0.8<br />
492695 SILVER CK @ CITY PARK AB PROSPECTOR SQUARE 10/1/1998 0.1<br />
492695 SILVER CK @ CITY PARK AB PROSPECTOR SQUARE 10/29/1998 0.000 0.087 0.5<br />
492695 SILVER CK @ CITY PARK AB PROSPECTOR SQUARE 12/17/1998 0.0<br />
492695 SILVER CK @ CITY PARK AB PROSPECTOR SQUARE 1/21/1999 0.0<br />
492695 SILVER CK @ CITY PARK AB PROSPECTOR SQUARE 2/18/1999 0.006<br />
0.470 0.5<br />
492695 SILVER CK @ CITY PARK AB PROSPECTOR SQUARE 3/26/1999 2.5<br />
Page 79
492695 SILVER CK @ CITY PARK AB PROSPECTOR SQUARE 4/14/1999 0.011<br />
492695 SILVER CK @ CITY PARK AB PROSPECTOR SQUARE 4/29/1999 0.005<br />
492695 SILVER CK @ CITY PARK AB PROSPECTOR SQUARE 5/14/1999 0.012<br />
492695 SILVER CK @ CITY PARK AB PROSPECTOR SQUARE 6/3/1999 0.005<br />
<strong>Silver</strong> <strong>Creek</strong> <strong>Water</strong>shed TMDL Final Report<br />
0.540 1.0<br />
0.530 15.0<br />
1.200 10.0<br />
0.550 10.0<br />
492695 SILVER CK @ CITY PARK AB PROSPECTOR SQUARE 6/17/1999 0.006 0.630 3.0<br />
492695 SILVER CK @ CITY PARK AB PROSPECTOR SQUARE 8/1/2001 0.000 0.097 0.1<br />
492695 SILVER CK @ CITY PARK AB PROSPECTOR SQUARE 9/6/2001 0.000 0.147 0.6<br />
492695 SILVER CK @ CITY PARK AB PROSPECTOR SQUARE 10/4/2001 0.006<br />
492695 SILVER CK @ CITY PARK AB PROSPECTOR SQUARE 11/8/2001 0.003<br />
492695 SILVER CK @ CITY PARK AB PROSPECTOR SQUARE 12/11/2001 0.006<br />
492695 SILVER CK @ CITY PARK AB PROSPECTOR SQUARE 1/9/2002 0.003<br />
492695 SILVER CK @ CITY PARK AB PROSPECTOR SQUARE 2/5/2002 0.002<br />
492695 SILVER CK @ CITY PARK AB PROSPECTOR SQUARE 2/11/2002 0.012<br />
492695 SILVER CK @ CITY PARK AB PROSPECTOR SQUARE 2/14/2002 0.012<br />
492695 SILVER CK @ CITY PARK AB PROSPECTOR SQUARE 2/18/2002 0.001<br />
1.010 2.4<br />
0.616 3.0<br />
0.754 0.3<br />
0.392 1.0<br />
0.456 0.5<br />
1.550 0.1<br />
1.460 0.0<br />
0.432 0.1<br />
492695 SILVER CK @ CITY PARK AB PROSPECTOR SQUARE<br />
2/21/2002 0.1<br />
492695 SILVER CK @ CITY PARK AB PROSPECTOR SQUARE 2/25/2002 0.002<br />
492695 SILVER CK @ CITY PARK AB PROSPECTOR SQUARE 3/6/2002 0.002<br />
492695 SILVER CK @ CITY PARK AB PROSPECTOR SQUARE 3/21/2002 0.003 0.328<br />
492695 SILVER CK @ CITY PARK AB PROSPECTOR SQUARE 4/11/2002 0.012<br />
492695 SILVER CK @ CITY PARK AB PROSPECTOR SQUARE 5/16/2002 0.003 0.223<br />
0.600 1.0<br />
0.496 1.0<br />
0.4<br />
1.450 4.0<br />
492695 SILVER CK @ CITY PARK AB PROSPECTOR SQUARE 6/6/2002 1.0<br />
492695 SILVER CK @ CITY PARK AB PROSPECTOR SQUARE 6/27/2002 0.2<br />
492697 PARK MEADOW DRAIN CK FROM GOLF COURSE AB SILVER CK 7/23/1998 0.000 0.042 12.0<br />
492697 PARK MEADOW DRAIN CK FROM GOLF COURSE AB SILVER CK 8/27/1998 3.0<br />
492697 PARK MEADOW DRAIN CK FROM GOLF COURSE AB SILVER CK 10/1/1998 2.5<br />
492697 PARK MEADOW DRAIN CK FROM GOLF COURSE AB SILVER CK 10/29/1998 0.000 0.000 2.0<br />
492697 PARK MEADOW DRAIN CK FROM GOLF COURSE AB SILVER CK 12/17/1998 2.4<br />
492697 PARK MEADOW DRAIN CK FROM GOLF COURSE AB SILVER CK 1/21/1999 0.000 0.000 12.0<br />
492697 PARK MEADOW DRAIN CK FROM GOLF COURSE AB SILVER CK 2/18/1999 0.000 0.120 0.4<br />
492697 PARK MEADOW DRAIN CK FROM GOLF COURSE AB SILVER CK 3/26/1999 3.1<br />
3.0<br />
Page 80
<strong>Silver</strong> <strong>Creek</strong> <strong>Water</strong>shed TMDL Final Report<br />
492697 PARK MEADOW DRAIN CK FROM GOLF COURSE AB SILVER CK 4/14/1999 0.000 0.046 2.5<br />
492697 PARK MEADOW DRAIN CK FROM GOLF COURSE AB SILVER CK 4/29/1999 0.001 0.210 8.0<br />
492697 PARK MEADOW DRAIN CK FROM GOLF COURSE AB SILVER CK 5/14/1999 0.000 0.050 10.0<br />
492697 PARK MEADOW DRAIN CK FROM GOLF COURSE AB SILVER CK 6/3/1999 16.0<br />
492697 PARK MEADOW DRAIN CK FROM GOLF COURSE AB SILVER CK 6/17/1999 0.000 0.031 6.0<br />
Page 81
<strong>Silver</strong> <strong>Creek</strong> <strong>Water</strong>shed TMDL Final Report<br />
Appendix B<br />
Seasonality and Statistical Analysis <strong>of</strong><br />
Uncertainty<br />
82
<strong>Silver</strong> <strong>Creek</strong> <strong>Water</strong>shed TMDL Final Report<br />
Seasonality and Statistical Analysis <strong>of</strong> Uncertainty<br />
Variability and Uncertainty<br />
As discussed in the body <strong>of</strong> this report, the issue <strong>of</strong> statistical reliability <strong>of</strong> data analysis was<br />
addressed by clustering the individual data points in Bi-Monthly (seasonal) time periods. This<br />
allowed for analysis <strong>of</strong> seasonal patterns. On the average there are 5.5 data points per period for<br />
Cadmium and 5.6 data points per period for Zinc. These numbers provide reasonable statistical<br />
validity for the conclusions presented. Table 1 shows average statistical parameters for the two<br />
constituents.<br />
Table 1: Average Statistical Parameters<br />
Constituent<br />
Coefficient <strong>of</strong> Coeff. <strong>of</strong> Variation <strong>of</strong> the<br />
Variation<br />
Means<br />
Cadmium 118% 50%<br />
Zinc 82% 35%<br />
The coefficients <strong>of</strong> variation above indicate that typical data points for cadmium and zinc are, on<br />
average, within 118% and 82%, respectively, <strong>of</strong> the mean value. However, there exists<br />
significant uncertainty as to the accuracy <strong>of</strong> the estimated means for these clusters. The<br />
coefficient <strong>of</strong> variation <strong>of</strong> the means represent how tightly clustered the mean values are<br />
(between stations) relative to the mean value.<br />
Seasonality<br />
The annual pattern <strong>of</strong> normalized zinc concentrations is shown in Figure 1. As indicated by the<br />
graphical representation <strong>of</strong> the normalized data, this annual pattern is consistent throughout the<br />
reaches <strong>of</strong> <strong>Silver</strong> <strong>Creek</strong> between Wanship and Park City. Concentrations increase sharply<br />
between the September-October period and the November-December period, even though flows<br />
do not yet show significant upswing. So it is not necessarily a feature <strong>of</strong> flow-induced scouring.<br />
83
<strong>Silver</strong> <strong>Creek</strong> <strong>Water</strong>shed TMDL Final Report<br />
Zinc Concentration - Normalized<br />
2.00<br />
1.80<br />
1.60<br />
1.40<br />
1.20<br />
1.00<br />
0.80<br />
0.60<br />
0.40<br />
Park City<br />
Richardson<br />
Above Atkinson<br />
Atkinson<br />
Wanship<br />
Overall Average<br />
0.20<br />
0.00<br />
0 Jan-Feb 1 Mar-Apr 2 May-Jun 3 Jul-Aug 4 Sep-Oct 5 Nov-Dec 6 7<br />
Bi-Monthly Period<br />
Figure 1: Annual Patterns <strong>of</strong> Zinc Concentrations<br />
The annual pattern <strong>of</strong> normalized flows is shown in Figure 2. This pattern is characteristic <strong>of</strong><br />
watersheds that are heavily influenced by snowmelt run<strong>of</strong>f. Note the peak flow period is May-<br />
June when concentrations have begun to decline.<br />
ANNUAL FLOW PATTERNS<br />
2.50<br />
2.00<br />
Average Flow - Normalized<br />
1.50<br />
1.00<br />
0.50<br />
-<br />
0 Jan-Feb 1 Mar-Apr 2 May-Jun 3 Jul-Aug 4 Sep-Oct 5 Nov-Dec 6<br />
Bi-Monthly Period<br />
Figure 2: Annual Flow Patterns<br />
84
<strong>Silver</strong> <strong>Creek</strong> <strong>Water</strong>shed TMDL Final Report<br />
Plotting Average Zinc Concentrations vs. Average Flow results in an Hysteresis Curve as shown<br />
in Figure 3. This plot shows values normalized by mean concentrations and flows. The mean<br />
values correspond to 1.0 on each axis. Values above or below 1.0 indicate values that are above<br />
or below the mean value. Early in the Winter season concentrations increase dramatically, even<br />
though flows have not yet begun to see the influence <strong>of</strong> significant snowmelt run<strong>of</strong>f. There are<br />
some possible explanations for this phenomenon, including the flushing <strong>of</strong> solubilized zinc from<br />
near-surface deposits at the onset <strong>of</strong> winter precipitation. However, the data are insufficient to<br />
verify this or other mechanisms.<br />
FLOW - ZINC CONCENTRATON HYSTERESIS RELATIONSHIP<br />
Based on Normalized Averages for the Five Key Stations<br />
1.60<br />
Jan-Feb<br />
Average Zinc Concentraton - Normalized<br />
1.40<br />
1.20<br />
1.00<br />
0.80<br />
0.60<br />
0.40<br />
Jul-Aug<br />
Nov-Dec<br />
Sep-Oct<br />
Mar-Apr<br />
May-Jun<br />
0.20<br />
-<br />
- 0.50 1.00 1.50 2.00 2.50<br />
Average Flow - Normalized<br />
Figure 3: Flow - Zinc Concentration Hysteresis Relationship<br />
The Annual Pattern <strong>of</strong> Zinc Loadings is more dramatic, as shown in Figure 4. The ratio <strong>of</strong> peak<br />
loadings in the Spring to minimum loadings in the Summer is about 8:1. This behavior could be<br />
incorporated in a comprehensive remediation strategy.<br />
85
<strong>Silver</strong> <strong>Creek</strong> <strong>Water</strong>shed TMDL Final Report<br />
ANNUAL ZINC LOADING PATTERN<br />
2.50<br />
2.00<br />
Average Loading - Normalized<br />
1.50<br />
1.00<br />
0.50<br />
-<br />
0 Jan-Feb 1 Mar-Apr 2 May-Jun 3 Jul-Aug 4 Sep-Oct 5 Nov-Dec 6<br />
Bi-Monthly Period<br />
Figure 4: Annual Pattern <strong>of</strong> Zinc Loadings - based on Normalized Data<br />
Hardness<br />
Seasonal analysis <strong>of</strong> hardness data for each <strong>of</strong> the five key sampling locations indicates that there<br />
is significant variation by season at all stations except 492685 (Richardson Flat). Figure 5 shows<br />
a graphical representation <strong>of</strong> annual average hardness by station. Table 2 and Figure 6 depict the<br />
seasonal variation using the bimonthly approach applied to other water quality data in this report.<br />
Table 2. Bi-monthly Hardness<br />
Bi-monthly Hardness<br />
Bi-monthly SeasonPark City Rich. Flats Abv. Atkin. Below Atkin. Wanship<br />
492695 492685 492680 492674 492675<br />
Jan.-Feb. 526 517 777 491 396<br />
Mar.- April 375 506 605 466 288<br />
May-June 247 487 494 486 323<br />
July-Aug. 376 498 622 384 409<br />
Sept.-Oct. 300 533 540 447 375<br />
Nov.-Dec. 325 529 683 548 406<br />
86
<strong>Silver</strong> <strong>Creek</strong> <strong>Water</strong>shed TMDL Final Report<br />
<strong>Silver</strong> <strong>Creek</strong> Average Annual Hardness<br />
700.00<br />
600.00<br />
Hardness mg/l<br />
500.00<br />
400.00<br />
300.00<br />
200.00<br />
100.00<br />
0.00<br />
492695<br />
(Pk City)<br />
492685<br />
(Rich. Flats)<br />
492680<br />
(Abv. Atkin)<br />
492674<br />
(Atkinson)<br />
492675<br />
(Wanship)<br />
Figure 5: Average Hardness values<br />
<strong>Silver</strong> <strong>Creek</strong> Bimonthly Hardness<br />
900<br />
800<br />
Average hardness 400 mg/l<br />
hardness mg/l<br />
700<br />
600<br />
500<br />
400<br />
300<br />
200<br />
100<br />
492695<br />
492685<br />
492680<br />
492674<br />
492675<br />
0<br />
Jan.-Feb.<br />
Mar.- April<br />
May-June<br />
July-Aug.<br />
Sept.-Oct.<br />
Nov.-Dec.<br />
Figure 6: Bimonthly Hardness<br />
87
<strong>Silver</strong> <strong>Creek</strong> <strong>Water</strong>shed TMDL Final Report<br />
Appendix C<br />
Comments Received On Draft TMDL And<br />
Responsiveness Summary<br />
88
<strong>Silver</strong> <strong>Creek</strong> <strong>Water</strong>shed TMDL Final Report<br />
March 25, 2004<br />
<strong>Silver</strong> <strong>Creek</strong> Draft Total Maximum Daily Load Responsiveness<br />
Summary<br />
The following responses address the major issues that were included in six comment letters and<br />
emails received on the Draft <strong>Silver</strong> <strong>Creek</strong> TMDL during the 30 day comment period that ended<br />
March 8, 2004. There were numerous additional comments that addressed editorial items and<br />
minor changes. These are not noted in this responsiveness summary but have been incorporated<br />
into the final TMDL.<br />
1. Several comments were received regarding the use <strong>of</strong> a maximum hardness value <strong>of</strong> 400<br />
mg/l for calculating the water quality standard for zinc and cadmium. One comment suggested<br />
that since the average hardness for <strong>Silver</strong> <strong>Creek</strong> was 484 mg/l that a hardness value rounded up<br />
to 500 mg/l should be used instead <strong>of</strong> 400.<br />
Response – The use <strong>of</strong> a maximum hardness <strong>of</strong> 400 mg/l for calculating hardness<br />
adjusted water quality standards for metals is in accordance with <strong>Utah</strong>’s R317-2-14.<br />
<strong>Utah</strong>’s use <strong>of</strong> this approach was specifically recommended by Region 8 EPA in a letter to<br />
the <strong>Division</strong> dated Dec. 20, 2001.<br />
The National Recommended <strong>Water</strong> <strong>Quality</strong> Criteria: 2002 (EPA 822-R-02-047 Nov.<br />
2002) specifically addresses this issue. A summary <strong>of</strong> the rationale for capping hardness<br />
at 400 mg/l from this guidance is as follows:<br />
(a) few good data exist to define the relationship between hardness and toxicity at hardness<br />
levels above 400 mg/L (although the number <strong>of</strong> data and the strength <strong>of</strong> the relationship<br />
vary from metal to metal, almost all <strong>of</strong> the available data concerning the relationship<br />
between hardness and toxicity are at hardness levels in the range from 20 to 400 mg/L),<br />
( b) in many waters with hardness above 400 mg/L, alkalinity and/or pH are lower than<br />
would be predicted based on the correlations that exist between hardness, alkalinity, and<br />
pH in lower hardness waters. This is significant because the relationship between<br />
hardness and toxicity is not due to hardness itself, but is wholly or partially due to<br />
constituents that are usually correlated with hardness, notably alkalinity and pH.<br />
EPA recommends following one <strong>of</strong> two approaches; that a hardness <strong>of</strong> 400 be used or a<br />
<strong>Water</strong> Effect Ratio (WER) study be conducted to demonstrate the actual toxicity at the<br />
ambient hardness. Completion <strong>of</strong> a WER would require significant budget and time to<br />
complete in accordance with EPA’s water effect ratio guidance. If any <strong>of</strong> the<br />
commenters would like to fund such a study, DWQ would be happy to undertake that<br />
approach and modify the TMDL in the future if results indicate it is appropriate.<br />
89
<strong>Silver</strong> <strong>Creek</strong> <strong>Water</strong>shed TMDL Final Report<br />
The final TMDL will utilize the alternative <strong>of</strong> using a maximum <strong>of</strong> 400 mg/l as the<br />
hardness for calculating zinc and cadmium water quality standards with the exception <strong>of</strong><br />
segments <strong>of</strong> the creek that show a seasonal hardness level below 400. Section 2.1 <strong>of</strong> the<br />
TMDL has been modified to provide the rationale behind using a maximum hardness <strong>of</strong><br />
400 in calculating the water quality standards applicable to the <strong>Silver</strong> <strong>Creek</strong> TMDL.<br />
2. Two comments were received that requested added information and justification<br />
regarding why <strong>Silver</strong> <strong>Creek</strong> was actually impaired. The TMDL document needed to do a better<br />
job explaining the link between high zinc and cadmium levels and impairment to cold water fish<br />
and their food chain.<br />
Response – Section 1.3 <strong>of</strong> the TMDL text has been modified to include a further<br />
explanation <strong>of</strong> the biology and chemistry regarding metals toxicity to aquatic organisms.<br />
3. One comment expressed concern that the <strong>Silver</strong> <strong>Creek</strong> TMDL was considered a “high<br />
priority” TMDL and suggested it be classified as a “medium priority” TMDL.<br />
Response - The priority designation <strong>of</strong> <strong>Utah</strong> TMDLs is a mechanism where UDWQ<br />
identifies what impaired water bodies will have TMDLs completed on over the following<br />
two year period. <strong>Silver</strong> <strong>Creek</strong> was designated “high priority” over two years ago when<br />
UDWQ committed to complete the <strong>Silver</strong> <strong>Creek</strong> TMDL by April 2004. UDWQ does not<br />
see any rationale nor compelling reason to modify this designation as the <strong>Silver</strong> <strong>Creek</strong><br />
TMDL is complete and will be submitted to EPA in April 2004.<br />
4. One comment requested that UDWQ provide a policy to support the recommendation in<br />
the TMDL that UPDES permit limits for the single point source in the watershed not be imposed<br />
until significant progress is made in cleaning up non-point sources <strong>of</strong> zinc and cadmium in the<br />
watershed.<br />
Response - The TMDL is quite clear in establishing the clean up targets that need to be<br />
achieved before imposition <strong>of</strong> UPDES permit limits should take effect. UDWQ does not feel<br />
an added policy is needed for this matter.<br />
5. Two comments indicated concern with the adequacy <strong>of</strong> the data set utilized to develop<br />
the TMDL. One comment expressed that the data set may not be adequate to set “strict water<br />
quality standards” and load allocations. The other comment focused on if the data was adequate<br />
to support selection <strong>of</strong> potential BMPs.<br />
Response - The TMDL report does acknowledge in section 3.2 that there are some<br />
limitations to the data set. However, UDWQ supports the approach utilized in clustering the<br />
data by station into two month intervals. This allows for seasonal analysis at each <strong>of</strong> the five<br />
monitoring stations. In the aggregate, over 230 and 226 sample results for zinc and cadmium<br />
respectively have been incorporated into the analysis used to derive the TMDL allocations.<br />
This represents sample results over a 12 year period <strong>of</strong> record from 1990 through 2002.<br />
Further, completion <strong>of</strong> the TMDL was delayed for a year to allow monthly sampling to be<br />
90
<strong>Silver</strong> <strong>Creek</strong> <strong>Water</strong>shed TMDL Final Report<br />
conducted from July 2001 through June 2002 by UDWQ to augment the data set prior to<br />
completion <strong>of</strong> the TMDL.<br />
The Margin <strong>of</strong> Safety utilized in the TMDL is an additional mechanism that is aimed directly<br />
at issues <strong>of</strong> uncertainty. UDWQ believes that the 25% explicit Margin <strong>of</strong> Safety utilized is<br />
appropriate to compensate for any uncertainty in the data set.<br />
Additional sampling will continue by UDWQ in accordance with the monitoring program<br />
outlined section 11.0 and should further bolster the data set for <strong>Silver</strong> <strong>Creek</strong>.<br />
In regard to selection <strong>of</strong> the best BMPs to be utilized for implementing the TMDL, the<br />
selection <strong>of</strong> BMPs should proceed following completion <strong>of</strong> the TMDL during the<br />
implementation phase. UDWQ is quite open to supplemental monitoring that may be<br />
appropriate in order to select the best BMP for a given site should that need be apparent.<br />
UDWQ will work closely with sponsoring parties on each implementation project to assure<br />
that appropriate BMPs are supported.<br />
6. One commenter wanted to make sure that the metals loading estimate provided for the<br />
Judge and Spiro tunnels in section 6.0 <strong>of</strong> the draft TMDL accurately reflected the actual flow and<br />
seasonality <strong>of</strong> flows from these two tunnels.<br />
Response - UDWQ used actual flow and metals data provided by Park City Municipal Corp.<br />
in calculating the loads contributed by the Judge and Spiro tunnels. The flows from the Spiro<br />
tunnel that enter the <strong>Silver</strong> <strong>Creek</strong> drainage were obtained from Mount Aire East Flume data<br />
provided by Joel Congor, Park City Municipal <strong>Water</strong> Dept. on 12-3-03.<br />
7. Two comments expressed concern with the water quality standard for cadmium that is<br />
used in the TMDL to establish the stream water quality endpoint or target <strong>of</strong> 0.00076 mg/l. One<br />
commenter questioned why the stream endpoint for the <strong>Silver</strong> <strong>Creek</strong> TMDL could be more<br />
stringent than the Primary Drinking <strong>Water</strong> Standard <strong>of</strong> 0.005 mg/l. Both commenters raised<br />
concern that the TMDL endpoint for cadmium was below current laboratory detection limits.<br />
One commenter noted that the drinking water best available treatment technology (BAT) can<br />
only treat drinking water to a .005 mg/l level.<br />
.<br />
Response – TMDL allocations must result in meeting water quality standards. The cadmium<br />
endpoint selected for the <strong>Silver</strong> <strong>Creek</strong> TMDL is the <strong>Utah</strong> <strong>Water</strong> <strong>Quality</strong> Standard from R317-<br />
2-14 adjusted for hardness for class 3A beneficial uses (cold water species <strong>of</strong> game fish).<br />
This value is the same as the cadmium value provided in the EPA National Recommended<br />
<strong>Water</strong> <strong>Quality</strong> Criteria: 2002 (EPA 822-R-02-047 Nov. 2002).<br />
Many <strong>of</strong> the metal water quality standards for aquatic beneficial uses are stricter than<br />
drinking water standards based on the fact that aquatic biota <strong>of</strong>ten have a greater sensitivity<br />
to metals than humans.<br />
The issue <strong>of</strong> the standard for cadmium being below the laboratory detection limit is a<br />
legitimate concern. The laboratory capability to analyze metals is improving. By the time<br />
91
<strong>Silver</strong> <strong>Creek</strong> <strong>Water</strong>shed TMDL Final Report<br />
clean up activities are well under way in 5 years or more, detection limits may be below the<br />
water quality standard. If this is not the case then the generally accepted laboratory detection<br />
limit will have to be used as the measure <strong>of</strong> success for cadmium in this TMDL.<br />
If after clean up actions are completed with all <strong>of</strong> the known source areas and water quality<br />
levels for cadmium in <strong>Silver</strong> <strong>Creek</strong> still do not achieve the respective water quality standards,<br />
it would be appropriate to undertake a formal Use Attainability Study to ascertain what the<br />
stream standard should be.<br />
In regard to UPDES permit limits imposed as a result <strong>of</strong> the TMDL, the current approach<br />
used for water quality standards that are below laboratory detection limits is to set the permit<br />
limit at the detection limit. The details <strong>of</strong> this would be worked out with the permitee at the<br />
time the permit limits are developed.<br />
8. One comment indicated that naturally occurring zinc concentrations as high as 74 ppm<br />
had been observed in soils in the <strong>Silver</strong> <strong>Creek</strong> drainage. The commenter wanted to know how<br />
the TMDL and the water quality standard for zinc have taken into account naturally occurring<br />
levels <strong>of</strong> zinc?<br />
Response – Given that the Park City area supported metal mining activities for around a<br />
century, it is not surprising to find naturally occurring zinc values as high as 74 ppm have<br />
been observed in area soils. What impact these naturally occurring values would have on<br />
background water quality is, at this point in time, virtually impossible to estimate in light <strong>of</strong><br />
the fact that 74 ppm pales in significance to some <strong>of</strong> the metals values <strong>of</strong> mining impacted<br />
areas in the watershed. As an example, in the meadow area between US-248 and I-80, the<br />
Innovative Assessment Analytical Results Report on Lower <strong>Silver</strong> <strong>Creek</strong> (DERR 2002)<br />
observed zinc concentrations in the 20,000 to 60,000 ppm level.<br />
Accordingly, if clean up actions are completed with all <strong>of</strong> the known source areas and water<br />
quality levels for zinc and cadmium in <strong>Silver</strong> <strong>Creek</strong> still do not achieve the respective water<br />
quality standards, it would be appropriate to undertake a Use Attainability Study to ascertain<br />
what the stream standard should be.<br />
9. One comment indicated that a more complete discussion <strong>of</strong> zinc and cadmium<br />
geochemistry should be included in the TMDL to include pH and hardness controls on the<br />
solubility <strong>of</strong> these two metals. The commenter requested that complete chemical analysis should<br />
be presented in the document for available samples.<br />
Response – A full explanation <strong>of</strong> the geochemistry <strong>of</strong> zinc and cadmium relative to pH and<br />
hardness is beyond the scope <strong>of</strong> the TMDL. A brief addition to the text has been included in<br />
Section 4.5 to address this need in part. The complete data set is available to any party that<br />
requests it but will not be added to the TMDL document.<br />
10. One comment expressed concern that the introduction to section 10 <strong>of</strong> the Draft TMDL<br />
indicated that actual clean up and remediation <strong>of</strong> the source areas for metals in <strong>Silver</strong> <strong>Creek</strong><br />
would best be handled in the Superfund arena. The commenter indicated that this would be<br />
92
<strong>Silver</strong> <strong>Creek</strong> <strong>Water</strong>shed TMDL Final Report<br />
contrary to the cooperative watershed approach that has been used in the <strong>Silver</strong> <strong>Creek</strong> watershed<br />
to date.<br />
Response - UDWQ agrees that a cooperative watershed approach should continue to be<br />
utilized in clean up <strong>of</strong> <strong>Silver</strong> <strong>Creek</strong>. The text <strong>of</strong> the TMDL has been modified to better<br />
reflect that the approach utilized in Superfund clean ups that includes detailed investigation<br />
<strong>of</strong> the nature, extent and scope <strong>of</strong> pollution along with detailed analysis <strong>of</strong> the feasibility <strong>of</strong><br />
clean up options is needed as the next step in this process. Most <strong>of</strong> the major source areas<br />
will need further study to determine the best approach to address the source areas for zinc<br />
and cadmium.<br />
11. One comment was received that expressed concern about future development activities<br />
impacting contaminated areas identified in the watershed. The TMDL report makes the<br />
assumption that future development will avoid contaminated areas and not contribute additional<br />
zinc and cadmium loads to <strong>Silver</strong> <strong>Creek</strong> (sections 4.4 and 6.2).<br />
Response – The current regulatory mechanisms that exist to prevent development activities<br />
from disturbing contaminated areas include the use <strong>of</strong> institutional controls via the Superfund<br />
program. In addition, because <strong>of</strong> liability under the Superfund program, real estate<br />
transactions go through a due diligence process to avoid any Superfund liability. UDWQ<br />
believes that this is sufficient to assume future development will not contribute additional<br />
zinc and cadmium loads to <strong>Silver</strong> <strong>Creek</strong>.<br />
12. One comment requested a more detailed presentation <strong>of</strong> how the TMDL addressed the<br />
seasonal variation in hardness at some <strong>of</strong> the water quality monitoring stations. Additionally,<br />
the commenter pointed out that station 492695 showed seasonally lower hardness values for the<br />
months <strong>of</strong> September through December.<br />
Response – Section 8.1 has been modified to include a more detailed description <strong>of</strong> how the<br />
seasonal hardness was addressed. This includes the seasonal hardness values at station<br />
492695 for September through December.<br />
13. One commenter recommended that a study be conducted to evaluate loadings <strong>of</strong> zinc and<br />
cadmium to Echo Reservoir and in reservoir sediments.<br />
Response – This recommendation is a valid extension <strong>of</strong> the work included in the <strong>Silver</strong><br />
<strong>Creek</strong> TMDL but outside the scope <strong>of</strong> this TMDL. When budget and manpower allows it<br />
UDWQ would consider such a study.<br />
14. One comment pointed out that section 6.0 includes loading estimates for the single<br />
permitted point source in the watershed and two mining tunnels that contribute zinc and<br />
cadmium to <strong>Silver</strong> <strong>Creek</strong>, however, no estimate was provided for the load contributed by the<br />
Prospector Drain.<br />
Response – The Prospector Drain outflow to <strong>Silver</strong> <strong>Creek</strong> is near the eastern end <strong>of</strong><br />
Prospector Park, immediately upstream from the <strong>Silver</strong> Maple Claims area. There is some<br />
93
<strong>Silver</strong> <strong>Creek</strong> <strong>Water</strong>shed TMDL Final Report<br />
uncertainty as to the seasonal flows from the drain, however sufficient data exists to estimate<br />
the annual load attributable to that source. Since the annual load from Prospector Drain is<br />
significant and most likely larger than the total <strong>of</strong> the three sources identified currently in the<br />
TMDL, UDWQ feels it is appropriate to include load estimates for the Prospector Drain in<br />
the TMDL. Section 6.0 has been modified accordingly.<br />
15. Concern was noted by one commenter about the reference to a 5 year implementation<br />
schedule and the uncertainty <strong>of</strong> obtaining the needed financial resources to effect clean up.<br />
Another commenter expressed concern that the TMDL did not provide stakeholders with<br />
information on the resources available to assist in clean up projects and that it is UDEQ’s<br />
responsibility to provide and or assist in obtaining clean up grants.<br />
Response – The scope and potential cost <strong>of</strong> implementing the clean up measures necessary to<br />
achieve the endpoints <strong>of</strong> the <strong>Silver</strong> <strong>Creek</strong> TMDL is quite daunting. UDWQ agrees that the<br />
five year estimate included in the TMDL is not realistic. The wording <strong>of</strong> Section 10.4 has<br />
been modified to reflect a more realistic time frame <strong>of</strong> 10 years.<br />
UDWQ does not agree that the responsibility for obtaining financial resources to effect clean<br />
up rests solely with UDWQ. UDWQ very much appreciates the cooperation <strong>of</strong> all <strong>of</strong> the<br />
stakeholders involved in this process and is committed to supporting and assisting where<br />
possible the clean up efforts needed. UDWQ will continue to work cooperatively with<br />
stakeholders and other local, state, and federal agencies to address the various projects<br />
needed to remedy the water quality impairments that currently exist in <strong>Silver</strong> <strong>Creek</strong>.<br />
16. One comment requested a change be made to section 8.3 regarding the time frame for<br />
implementing effluent limits for the <strong>Silver</strong> <strong>Creek</strong> <strong>Water</strong> Reclamation Facility. The current<br />
TMDL indicates that point source effluent limits should not be imposed until a 75% reduction in<br />
upstream non-point sources is achieved. The commenter requested that the 75% reduction be<br />
calculated in a different manner resulting in even more clean up being achieved before the point<br />
source effluent limits were imposed.<br />
Response – UDWQ believes that the current calculation <strong>of</strong> clean up needed is accurate and<br />
adequate.<br />
17. One commenter noted that the evaluation <strong>of</strong> load per distance depicted in section 4.4 and<br />
Table 9 results in a diminished importance being given to the stream reach between Richardson<br />
Flat and station 492680 (above Atkinson) when in fact this stream reach results in the overall<br />
largest load contribution <strong>of</strong> any.<br />
Response - UDWQ agrees with the comment. The segment <strong>of</strong> the stream between<br />
Richardson and the above Atkinson station contributes approximately 5000 lbs. per year <strong>of</strong><br />
zinc. The next largest contribution <strong>of</strong> 3000 lbs. per year is in the reach between the Park City<br />
monitoring station and Richardson Flat. The text in section 4.3 has been modified to address<br />
this comment.<br />
94
<strong>Silver</strong> <strong>Creek</strong> <strong>Water</strong>shed TMDL Final Report<br />
18. One comment pointed out that the TMDL report needed to clarify if total, dissolved, or a<br />
mix <strong>of</strong> water quality results was used for the analysis <strong>of</strong> zinc and cadmium. If both total and<br />
dissolved values were used to derive the TMDL allocations for cadmium and zinc, then a<br />
discussion should be added to the document to clarify how this should be interpreted.<br />
Response – A review <strong>of</strong> the data set shows that there were only 7 instances where total zinc<br />
or total cadmium were available. This is not a sufficient number <strong>of</strong> data points to use in this<br />
analysis. The analysis presented in the TMDL is based on dissolved values. The text in<br />
section 3.3 has been modified to reflect this.<br />
19. Several comments indicated that the TMDL report needed to include a better explanation<br />
<strong>of</strong> science behind the impairment listing. Information should be included that demonstrates the<br />
biological implications to fish and their food chain when metals values exceed water quality<br />
standards.<br />
Response – Text has been added to the TMDL report in Section 1.3 to provide this<br />
information.<br />
95
<strong>Silver</strong> <strong>Creek</strong> <strong>Water</strong>shed TMDL Final Report<br />
_______________________________________________________<br />
TOTAL MAXIMUM DAILY LOAD FOR DISSOLVED ZINC AND CADMIUM IN<br />
SILVER CREEK, SUMMIT COUNTY, UTAH,____________________<br />
DRAFT Report: February 5, 2004<br />
COMMENTS by<br />
UTAH BLM<br />
Salt Lake Field Office<br />
Page #<br />
Comment<br />
3 Significant Sources: Note that the Floodplain tailings occur on the east<br />
side <strong>of</strong> the <strong>Silver</strong> Maple Claims site and this land, according to our Realty<br />
Specialist, belongs to Park City Municipal Corporation (Owner).<br />
7 Fig 1 What do the numbers 695, 697, 685 and 680 represent?<br />
7 Fig 1 There is a strange box-like polygon on highway U-248 in the figure. What is it?<br />
8 How are the hydrologic data inconsistent and where are they limited in the<br />
watershed?<br />
30 Zinc, para 3, “However, careful consideration must also be given to the sequence<br />
<strong>of</strong> clean up from an upstream to downstream order to insure that upstream sources<br />
do not contaminate areas downstream that have been addressed earlier.” I agree<br />
with this approach.<br />
30 Zinc, 4.4, para 4, “Between Park City and Richardson, the incremental load<br />
amounts to about 3,000 pounds per year. Therefore, the focus <strong>of</strong> attention as far as<br />
remediation should be in the reach <strong>of</strong> <strong>Silver</strong> <strong>Creek</strong> between Park City and<br />
Atkinson.” Should this be between Richardson and Atkinson instead <strong>of</strong> between<br />
Prospector and Atkinson?<br />
30 Zinc, 4.4, para 5, “It is expected that all future development activities will avoid<br />
contaminated areas and as a result it is expected that these areas will not<br />
contribute zinc or cadmium load to <strong>Silver</strong> <strong>Creek</strong>.” How can we protect cleaned<br />
up areas ? I don’t think it is a good assumption that future development activities<br />
will avoid these areas once they are cleaned up, do you? The <strong>Silver</strong> Maple Claims<br />
site is a perfect example. The site has been annexed by Park City. Future plans by<br />
the city for that area have never been fully discussed or clearly stated.<br />
It may be useful to review from EPA’s website a description <strong>of</strong> the<br />
96
<strong>Silver</strong> <strong>Creek</strong> <strong>Water</strong>shed TMDL Final Report<br />
NFRAP ( No Further Remediation Action Planned) <strong>of</strong> the <strong>Silver</strong> Maple Claims<br />
site as <strong>of</strong> 11/8/2000:<br />
“This site (<strong>Silver</strong> Maple Claims Site) is located on a 38 acre parcel <strong>of</strong> public<br />
land within the <strong>Silver</strong> <strong>Creek</strong> drainage area about one mile northeast <strong>of</strong> downtown<br />
Park City. The site is situated between two prominent land features known as the<br />
Prospectors Square Subdivision <strong>of</strong> Park City and Richardson Flats. The<br />
environmental impact report for the groundwater and surface water study<br />
concluded that the tailings in the Prospector Square area are affecting<br />
groundwater quality in the unconsolidated valley fill aquifer.”<br />
33 Table 10: List <strong>of</strong> Known Sources: A considerable amount <strong>of</strong> tailings materials<br />
occur below (east) <strong>of</strong> BLM’s <strong>Silver</strong> Maple Claims site and is thought to be owned<br />
by Park City Municipal Corporation (conversation with Mike Nelson).<br />
36 Table 11: Source Information: <strong>Silver</strong> Maple Claims- BLM add<br />
1) BLM, Site Investigation (SI) 2003; 2) Wetland Functional Assessment, 2003<br />
Dynamac, 3) Macro-invertebrate study, 2003, University <strong>of</strong> <strong>Utah</strong>,<br />
4) Geoprobe coring, Dynamac, 2003.<br />
36 6.2, Future Sources. “It is expected that all future development activities<br />
will avoid contaminated areas and, as a result, it is expected that these areas will<br />
not contribute zinc or cadmium load to <strong>Silver</strong> <strong>Creek</strong>.”<br />
I am not sure what this is saying for future development activities at Prospector<br />
Square and/or at the <strong>Silver</strong> Maple Claims area. Is there some regulatory<br />
enforcement “teeth” behind this expectation? Any activities that will increase the<br />
contaminant run<strong>of</strong>f to the PC pipe should be regulated for successful downstream<br />
efforts. Likewise any planned activities by others (ie. Park City, BLM has no<br />
plans for any development <strong>of</strong> the <strong>Silver</strong> Maple Claims site to date) should also be<br />
regulated.<br />
40 <strong>Silver</strong> <strong>Creek</strong> <strong>Water</strong> Reclamation Facility: Where and what is this? Is this the<br />
same facility as the Snyderville Wastewater Treatment Plant?<br />
BLM still wonders if it is possible to hook the Prospector drain up to the<br />
Exit sting sewer system in which the fluids would effectively bypass the <strong>Silver</strong><br />
Maple Claims Site to the wastewater treatment plant.<br />
44 Temporary Erosion Control: How is downward water percolation dealt with in<br />
the Park City Contaminated Soils Ordinance? This downward percolation is <strong>of</strong><br />
concern to BLM because we assume that downward water would percolate<br />
through the large tailings pile at Prospector Square and may source the Prospector<br />
Drain which is flowing onto BLM. This downward percolation <strong>of</strong> water I believe<br />
should be identified as a source <strong>of</strong> contamination and contribution to the<br />
Prospector Drain.<br />
97
<strong>Silver</strong> <strong>Creek</strong> <strong>Water</strong>shed TMDL Final Report<br />
50 <strong>Silver</strong> Maple Claims: What are the recommended BMPs for the BLM’s <strong>Silver</strong><br />
Maple Claims site?<br />
54 Park City to Richardson Flat: No where in the implementation measures<br />
efficiencies and costs do you address the Prospector Drain or its possible remedy.<br />
54 Park City to Richardson Flat: BLM’s <strong>Silver</strong> Maple Claims site has diminished in<br />
size to 38.35 acres since 26.61 acres were transferred to the Air Force north <strong>of</strong><br />
the highway. Where did the 387,197 number <strong>of</strong> cubic yards <strong>of</strong> tailings come from<br />
for the <strong>Silver</strong> Maple Claims site?<br />
55 Implementation Schedule: Change Draft EE/CA Spring/Summer 2004,<br />
Cleanup begins following Park City drain pipe resolution.<br />
58 Tim Ingwell is key contact (Project Manager) not Mike Nelson.<br />
59 REFERENCES: You might like to add the following relevant reference.<br />
Giddings, E.M., Hornberger, M.I. and Hadley, H.K., 2001, Trace-metal<br />
concentrations in sediment and water and health <strong>of</strong> aquatic macroinvertebrate<br />
communities <strong>of</strong> streams near Park City, USGS <strong>Water</strong> Resources Investigation<br />
Report 01-4213, 22p.<br />
I would be interested in getting a copy <strong>of</strong> the Brodie, et.al., 1993 paper on staged<br />
aerobic wetlands based acid drainage treatment systems design.<br />
John, that is my review in a nutshell. The writing was clear. The figures where easy to<br />
read and interpret. Figure 5, the <strong>Silver</strong> <strong>Creek</strong> Hydrology Map, I thought should have been<br />
more legible. Maybe a smaller subset <strong>of</strong> maps that zero in on these areas would work<br />
better. The same comment applies to Figure 22- <strong>Silver</strong> <strong>Creek</strong> Contaminant Source Map.<br />
I would welcome a more detailed map from Prospector Square to Richardson Flat.<br />
Overall a nice Draft Report John.<br />
98
<strong>Silver</strong> <strong>Creek</strong> <strong>Water</strong>shed TMDL Final Report<br />
From:<br />
To:<br />
Date:<br />
Subject:<br />
"Briant A Kimball" <br />
<br />
2/25/2004 9:48:49 AM<br />
TMDL<br />
John,<br />
Let me make a few comments on the draft TMDL. You did a good job going<br />
through it the other day. It was short and sweet.<br />
1. p. 19: I am very curious why the concentrations are lowest in July<br />
and August for Cd and Zn. This is not really an expected pattern. There<br />
would be a great percentage <strong>of</strong> base flow, and so I would expect<br />
concentrations to be higher. I know you have to work with 0.45-micrometer<br />
filtration, but I have to wonder if there are not some procedure artifacts<br />
in the dataset. I may take some ultrafiltrate samples when we work this<br />
spring to investigate that. The only physical or chemical explanation I can<br />
think <strong>of</strong> would be that the sources dry up and just stop contributing.<br />
2. p. 22: Where our synoptic data are included the values are <strong>of</strong>ten<br />
high, as in figure 13. I would expect that because <strong>of</strong> the extreme dry<br />
conditions when we sampled.<br />
3. p. 23: We had Cd data that are not included in Figures 14, 17 and 19.<br />
Any particular reason for leaving them out?<br />
4. p. 30, first paragraph: This evaluation <strong>of</strong> load per distance is<br />
right, but seems to lessen the importance <strong>of</strong> the Meadow area as a source.<br />
The load from that area overall is much greater than the load that seems<br />
more important in this paragraph.<br />
5. p. 34, figure 22: I don't thin you have the right location for the<br />
Prospector Square Ground <strong>Water</strong> Drain. It falls right on the stream.<br />
6. p. 50, Prospector Square: the pipe is not upstream <strong>of</strong> <strong>Silver</strong> Maple<br />
but within <strong>Silver</strong> Maple, if the fence is right on the boundary.<br />
7. p. 50: Flood plains tailings: You might want to say the "source <strong>of</strong><br />
water" rather than the "source <strong>of</strong> hydrology."<br />
I hope these make sense. None <strong>of</strong> them is real serious; just suggestions. I<br />
found that I agreed with most everything as I read through it.<br />
--------------------------------------------------------------------------<br />
Briant A. Kimball<br />
U.S. Geological Survey<br />
2329 W Orton Cir<br />
West Valley, UT 84119-2047<br />
Phone: 801-908-5047<br />
Fax: 801-908-5001<br />
Email: bkimball@usgs.<strong>gov</strong><br />
99
<strong>Silver</strong> <strong>Creek</strong> <strong>Water</strong>shed TMDL Final Report<br />
100
<strong>Silver</strong> <strong>Creek</strong> <strong>Water</strong>shed TMDL Final Report<br />
101
<strong>Silver</strong> <strong>Creek</strong> <strong>Water</strong>shed TMDL Final Report<br />
102
<strong>Silver</strong> <strong>Creek</strong> <strong>Water</strong>shed TMDL Final Report<br />
103
<strong>Silver</strong> <strong>Creek</strong> <strong>Water</strong>shed TMDL Final Report<br />
104
<strong>Silver</strong> <strong>Creek</strong> <strong>Water</strong>shed TMDL Final Report<br />
105
<strong>Silver</strong> <strong>Creek</strong> <strong>Water</strong>shed TMDL Final Report<br />
106
<strong>Silver</strong> <strong>Creek</strong> <strong>Water</strong>shed TMDL Final Report<br />
107
<strong>Silver</strong> <strong>Creek</strong> <strong>Water</strong>shed TMDL Final Report<br />
108
<strong>Silver</strong> <strong>Creek</strong> <strong>Water</strong>shed TMDL Final Report<br />
109
<strong>Silver</strong> <strong>Creek</strong> <strong>Water</strong>shed TMDL Final Report<br />
110
<strong>Silver</strong> <strong>Creek</strong> <strong>Water</strong>shed TMDL Final Report<br />
111
<strong>Silver</strong> <strong>Creek</strong> <strong>Water</strong>shed TMDL Final Report<br />
112
<strong>Silver</strong> <strong>Creek</strong> <strong>Water</strong>shed TMDL Final Report<br />
113
<strong>Silver</strong> <strong>Creek</strong> <strong>Water</strong>shed TMDL Final Report<br />
114