Silver Creek - Division of Water Quality - Utah.gov
Silver Creek - Division of Water Quality - Utah.gov
Silver Creek - Division of Water Quality - Utah.gov

Create successful ePaper yourself
Turn your PDF publications into a flip-book with our unique Google optimized e-Paper software.
<strong>Silver</strong> <strong>Creek</strong> <strong>Water</strong>shed TMDL Final Report<br />
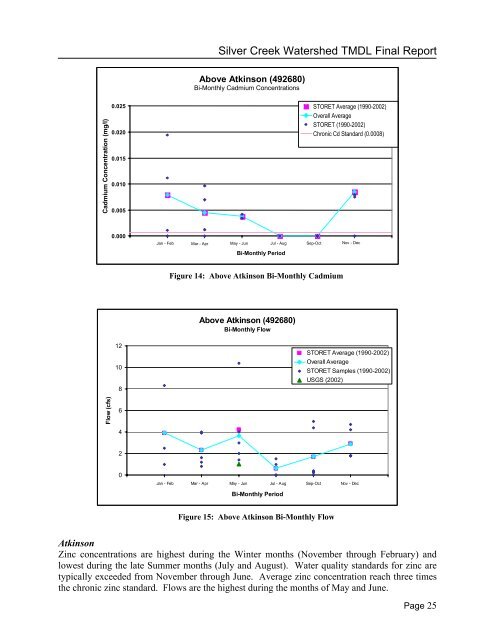
Above Atkinson (492680)<br />
Bi-Monthly Cadmium Concentrations<br />
Cadmium Concentration (mg/l)<br />
0.025<br />
0.020<br />
0.015<br />
0.010<br />
0.005<br />
STORET Average (1990-2002)<br />
Overall Average<br />
STORET (1990-2002)<br />
Chronic Cd Standard (0.0008)<br />
0.000<br />
0 Jan - 1 Feb Mar - Apr 2 May - 3Jun<br />
Jul - Nov - Dec<br />
4Aug<br />
Sep-Oct 5 6 7<br />
Bi-Monthly Period<br />
Figure 14: Above Atkinson Bi-Monthly Cadmium<br />
Above Atkinson (492680)<br />
Bi-Monthly Flow<br />
12<br />
10<br />
8<br />
STORET Average (1990-2002)<br />
Overall Average<br />
STORET Samples (1990-2002)<br />
USGS (2002)<br />
Flow (cfs)<br />
6<br />
4<br />
2<br />
0<br />
0 Jan 1- Feb Mar - 2Apr<br />
May 3- Jun<br />
Jul 4- Aug Sep-Oct 5 Nov 6- Dec 7<br />
Bi-Monthly Period<br />
Figure 15: Above Atkinson Bi-Monthly Flow<br />
Atkinson<br />
Zinc concentrations are highest during the Winter months (November through February) and<br />
lowest during the late Summer months (July and August). <strong>Water</strong> quality standards for zinc are<br />
typically exceeded from November through June. Average zinc concentration reach three times<br />
the chronic zinc standard. Flows are the highest during the months <strong>of</strong> May and June.<br />
Page 25