Silver Creek - Division of Water Quality - Utah.gov
Silver Creek - Division of Water Quality - Utah.gov
Silver Creek - Division of Water Quality - Utah.gov

You also want an ePaper? Increase the reach of your titles
YUMPU automatically turns print PDFs into web optimized ePapers that Google loves.
<strong>Silver</strong> <strong>Creek</strong> <strong>Water</strong>shed TMDL Final Report<br />
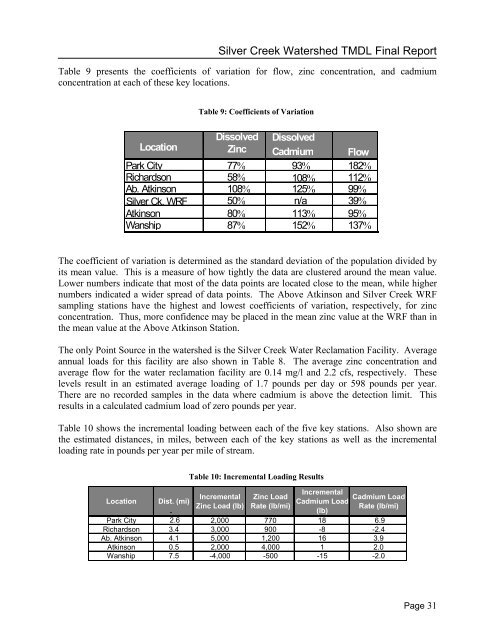
Table 9 presents the coefficients <strong>of</strong> variation for flow, zinc concentration, and cadmium<br />
concentration at each <strong>of</strong> these key locations.<br />
Table 9: Coefficients <strong>of</strong> Variation<br />
Location<br />
Dissolved Dissolved<br />
Zinc Cadmium Flow<br />
Park City 77% 93% 182%<br />
Richardson 58% 108% 112%<br />
Ab. Atkinson 108% 125% 99%<br />
<strong>Silver</strong> Ck. WRF 50% n/a 39%<br />
Atkinson 80% 113% 95%<br />
Wanship 87% 152% 137%<br />
The coefficient <strong>of</strong> variation is determined as the standard deviation <strong>of</strong> the population divided by<br />
its mean value. This is a measure <strong>of</strong> how tightly the data are clustered around the mean value.<br />
Lower numbers indicate that most <strong>of</strong> the data points are located close to the mean, while higher<br />
numbers indicated a wider spread <strong>of</strong> data points. The Above Atkinson and <strong>Silver</strong> <strong>Creek</strong> WRF<br />
sampling stations have the highest and lowest coefficients <strong>of</strong> variation, respectively, for zinc<br />
concentration. Thus, more confidence may be placed in the mean zinc value at the WRF than in<br />
the mean value at the Above Atkinson Station.<br />
The only Point Source in the watershed is the <strong>Silver</strong> <strong>Creek</strong> <strong>Water</strong> Reclamation Facility. Average<br />
annual loads for this facility are also shown in Table 8. The average zinc concentration and<br />
average flow for the water reclamation facility are 0.14 mg/l and 2.2 cfs, respectively. These<br />
levels result in an estimated average loading <strong>of</strong> 1.7 pounds per day or 598 pounds per year.<br />
There are no recorded samples in the data where cadmium is above the detection limit. This<br />
results in a calculated cadmium load <strong>of</strong> zero pounds per year.<br />
Table 10 shows the incremental loading between each <strong>of</strong> the five key stations. Also shown are<br />
the estimated distances, in miles, between each <strong>of</strong> the key stations as well as the incremental<br />
loading rate in pounds per year per mile <strong>of</strong> stream.<br />
Table 10: Incremental Loading Results<br />
Incremental<br />
Cadmium Load<br />
Cadmium Load<br />
Rate (lb/mi)<br />
Incremental Zinc Load<br />
Location Dist. (mi)<br />
Zinc Load (lb) Rate (lb/mi)<br />
-<br />
(lb)<br />
Park City 2.6 2,000 770 18 6.9<br />
Richardson 3.42<br />
3,000 900 -8 -2.4<br />
Ab. Atkinson 4.1 5,000 1,200 16 3.9<br />
Atkinson 0.5 2,000 4,000 1 2.0<br />
Wanship 7.5 -4,000 -500 -15 -2.0<br />
Page 31