Silver Creek - Division of Water Quality - Utah.gov
Silver Creek - Division of Water Quality - Utah.gov
Silver Creek - Division of Water Quality - Utah.gov

Create successful ePaper yourself
Turn your PDF publications into a flip-book with our unique Google optimized e-Paper software.
<strong>Silver</strong> <strong>Creek</strong> <strong>Water</strong>shed TMDL Final Report<br />
8.0 TMDL<br />
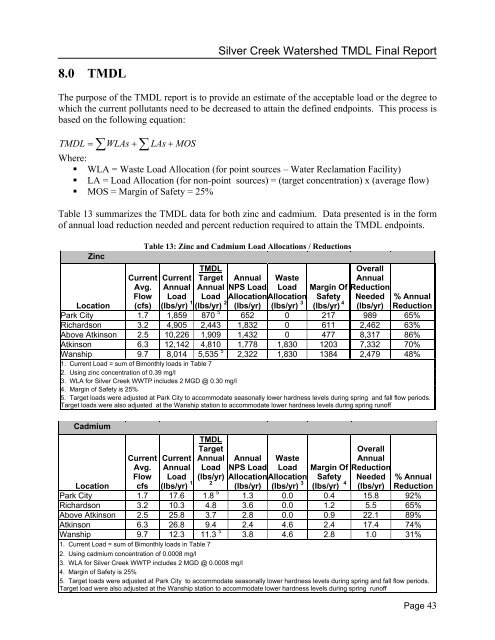
The purpose <strong>of</strong> the TMDL report is to provide an estimate <strong>of</strong> the acceptable load or the degree to<br />
which the current pollutants need to be decreased to attain the defined endpoints. This process is<br />
based on the following equation:<br />
∑WLAs<br />
+ ∑ LAs +<br />
TMDL = MOS<br />
Where:<br />
• WLA = Waste Load Allocation (for point sources – <strong>Water</strong> Reclamation Facility)<br />
• LA = Load Allocation (for non-point sources) = (target concentration) x (average flow)<br />
• MOS = Margin <strong>of</strong> Safety = 25%<br />
Table 13 summarizes the TMDL data for both zinc and cadmium. Data presented is in the form<br />
<strong>of</strong> annual load reduction needed and percent reduction required to attain the TMDL endpoints.<br />
Zinc<br />
Table 13: Zinc and Cadmium Load Allocations / Reductions<br />
Current Current<br />
TMDL<br />
Target Annual Waste<br />
Overall<br />
Annual<br />
Avg. Annual Annual NPS Load Load Margin Of Reduction<br />
Flow Load Load Allocation Allocation Safety Needed % Annual<br />
Location (cfs) (lbs/yr) 1 (lbs/yr) 2 (lbs/yr) (lbs/yr) 3 (lbs/yr) 4 (lbs/yr) Reduction<br />
Park City 1.7 1,859 870 5 652 0 217 989 65%<br />
Richardson 3.2 4,905 2,443 1,832 0 611 2,462 63%<br />
Above Atkinson 2.5 10,226 1,909 1,432 0 477 8,317 86%<br />
Atkinson 6.3 12,142 4,810 1,778 1,830 1203 7,332 70%<br />
Wanship 9.7 8,014 5,535 5 2,322 1,830 1384 2,479 48%<br />
1. Current Load = sum <strong>of</strong> Bimonthly loads in Table 7<br />
2. Using zinc concentration <strong>of</strong> 0.39 mg/l<br />
3. WLA for <strong>Silver</strong> <strong>Creek</strong> WWTP includes 2 MGD @ 0.30 mg/l<br />
4. Margin <strong>of</strong> Safety is 25%<br />
5. Target loads were adjusted at Park City to accommodate seasonally lower hardness levels during spring and fall flow periods.<br />
Target loads were also adjusted at the Wanship station to accommodate lower hardness levels during spring run<strong>of</strong>f<br />
Cadmium<br />
TMDL<br />
Target<br />
Current Current Annual Annual Waste<br />
Overall<br />
Annual<br />
Avg. Annual Load NPS Load Load Margin Of Reduction<br />
Flow Load (lbs/yr) Allocation Allocation Safety Needed % Annual<br />
Location cfs (lbs/yr) 1 2<br />
(lbs/yr) (lbs/yr) 3 (lbs/yr) 4 (lbs/yr) Reduction<br />
Park City 1.7 17.6 1.8 5 1.3 0.0 0.4 15.8 92%<br />
Richardson 3.2 10.3 4.8 3.6 0.0 1.2 5.5 65%<br />
Above Atkinson 2.5 25.8 3.7 2.8 0.0 0.9 22.1 89%<br />
Atkinson 6.3 26.8 9.4 2.4 4.6 2.4 17.4 74%<br />
Wanship 9.7 12.3 11.3 5 3.8 4.6 2.8 1.0 31%<br />
1. Current Load = sum <strong>of</strong> Bimonthly loads in Table 7<br />
2. Using cadmium concentration <strong>of</strong> 0.0008 mg/l<br />
3. WLA for <strong>Silver</strong> <strong>Creek</strong> WWTP includes 2 MGD @ 0.0008 mg/l<br />
4. Margin <strong>of</strong> Safety is 25%<br />
5. Target loads were adjusted at Park City to accommodate seasonally lower hardness levels during spring and fall flow periods.<br />
Target load were also adjusted at the Wanship station to accommodate lower hardness levels during spring run<strong>of</strong>f<br />
Page 43