Silver Creek - Division of Water Quality - Utah.gov
Silver Creek - Division of Water Quality - Utah.gov
Silver Creek - Division of Water Quality - Utah.gov

You also want an ePaper? Increase the reach of your titles
YUMPU automatically turns print PDFs into web optimized ePapers that Google loves.
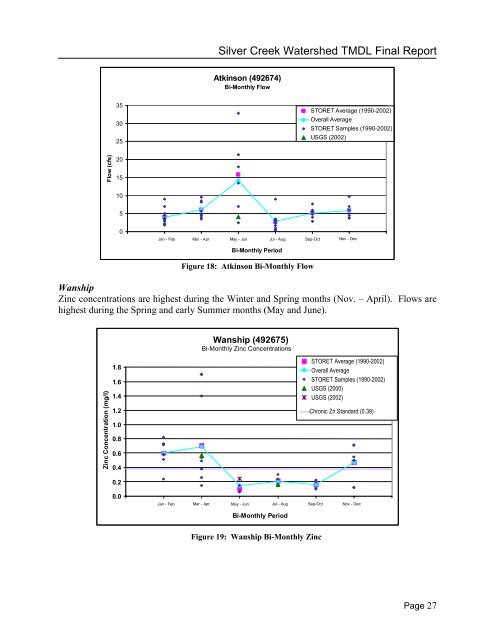
<strong>Silver</strong> <strong>Creek</strong> <strong>Water</strong>shed TMDL Final Report<br />
Atkinson (492674)<br />
Bi-Monthly Flow<br />
35<br />
30<br />
25<br />
STORET Average (1990-2002)<br />
Overall Average<br />
STORET Samples (1990-2002)<br />
USGS (2002)<br />
Flow (cfs)<br />
20<br />
15<br />
10<br />
5<br />
0<br />
0<br />
Jan<br />
1- Feb Mar<br />
2- Apr<br />
May<br />
3- Jun<br />
Jul<br />
4- Aug Sep-Oct<br />
5 6<br />
Bi-Monthly Period<br />
Figure 18: Atkinson Bi-Monthly Flow<br />
Nov - Dec<br />
7<br />
Wanship<br />
Zinc concentrations are highest during the Winter and Spring months (Nov. – April). Flows are<br />
highest during the Spring and early Summer months (May and June).<br />
Wanship (492675)<br />
Bi-Monthly Zinc Concentrations<br />
Zinc Concentration (mg/l)<br />
1.8<br />
1.6<br />
1.4<br />
1.2<br />
1.0<br />
0.8<br />
0.6<br />
0.4<br />
STORET Average (1990-2002)<br />
Overall Average<br />
STORET Samples (1990-2002)<br />
USGS (2000)<br />
USGS (2002)<br />
Chronic Zn Standard (0.39)<br />
0.2<br />
0.0<br />
0 Jan 1 - Feb Mar<br />
2- Apr<br />
May 3- Jun<br />
Jul<br />
4- Aug Sep-Oct<br />
5<br />
Nov -<br />
6<br />
Dec<br />
7<br />
Bi-Monthly Period<br />
Figure 19: Wanship Bi-Monthly Zinc<br />
Page 27