Gender Equality Index Report - European Institute for Gender ...
Gender Equality Index Report - European Institute for Gender ...
Gender Equality Index Report - European Institute for Gender ...

Create successful ePaper yourself
Turn your PDF publications into a flip-book with our unique Google optimized e-Paper software.
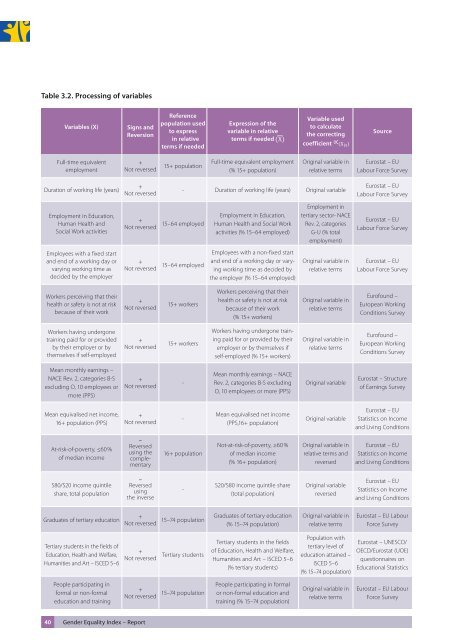
Table 3.2. Processing of variables<br />
Variables (X)<br />
Signs and<br />
Reversion<br />
Reference<br />
population used<br />
to express<br />
X in relative<br />
terms if needed<br />
Expression of the<br />
variable in relative<br />
terms if needed<br />
Variable used<br />
to calculate<br />
the correcting<br />
coefficient_____<br />
Source<br />
Full-time equivalent<br />
employment<br />
+<br />
Not reversed<br />
15+ population<br />
Full-time equivalent employment<br />
(% 15+ population)<br />
Original variable in<br />
relative terms<br />
Eurostat – EU<br />
Labour Force Survey<br />
Duration of working life (years)<br />
+<br />
Not reversed<br />
- Duration of working life (years) Original variable<br />
Eurostat – EU<br />
Labour Force Survey<br />
Employment in Education,<br />
Human Health and<br />
Social Work activities<br />
Employees with a fixed start<br />
and end of a working day or<br />
varying working time as<br />
decided by the employer<br />
Employment in Education,<br />
+<br />
Not reversed 15–64 employed Human Health and Social Work<br />
activities (% 15–64 employed)<br />
Employees with a non-fixed start<br />
+<br />
Not reversed 15–64 employed and end of a working day or varying<br />
working time as decided by<br />
the employer (% 15–64 employed)<br />
Employment in<br />
tertiary sector- NACE<br />
Rev. 2, categories<br />
G-U (% total<br />
employment)<br />
Original variable in<br />
relative terms<br />
Eurostat – EU<br />
Labour Force Survey<br />
Eurostat – EU<br />
Labour Force Survey<br />
Workers perceiving that their<br />
health or safety is not at risk<br />
because of their work<br />
+<br />
Not reversed<br />
15+ workers<br />
Workers perceiving that their<br />
health or safety is not at risk<br />
because of their work<br />
(% 15+ workers)<br />
Original variable in<br />
relative terms<br />
Eurofound –<br />
<strong>European</strong> Working<br />
Conditions Survey<br />
Workers having undergone<br />
training paid <strong>for</strong> or provided<br />
by their employer or by<br />
themselves if self-employed<br />
+<br />
Not reversed<br />
15+ workers<br />
Workers having undergone training<br />
paid <strong>for</strong> or provided by their<br />
employer or by themselves if<br />
self-employed (% 15+ workers)<br />
Original variable in<br />
relative terms<br />
Eurofound –<br />
<strong>European</strong> Working<br />
Conditions Survey<br />
Mean monthly earnings –<br />
NACE Rev. 2, categories B-S<br />
excluding O, 10 employees or<br />
more (PPS)<br />
+<br />
Not reversed<br />
-<br />
Mean monthly earnings – NACE<br />
Rev. 2, categories B-S excluding<br />
O, 10 employees or more (PPS)<br />
Original variable<br />
Eurostat – Structure<br />
of Earnings Survey<br />
Mean equivalised net income,<br />
16+ population (PPS)<br />
+<br />
Not reversed<br />
-<br />
Mean equivalised net income<br />
(PPS,16+ population)<br />
Original variable<br />
Eurostat – EU<br />
Statistics on Income<br />
and Living Conditions<br />
At-risk-of-poverty, ≤60 %<br />
of median income<br />
–<br />
Reversed<br />
using the<br />
complementary<br />
16+ population<br />
Not-at-risk-of-poverty, ≥60 %<br />
of median income<br />
(% 16+ population)<br />
Original variable in<br />
relative terms and<br />
reversed<br />
Eurostat – EU<br />
Statistics on Income<br />
and Living Conditions<br />
S80/S20 income quintile<br />
share, total population<br />
–<br />
Reversed<br />
using<br />
the inverse<br />
-<br />
S20/S80 income quintile share<br />
(total population)<br />
Original variable<br />
reversed<br />
Eurostat – EU<br />
Statistics on Income<br />
and Living Conditions<br />
Graduates of tertiary education<br />
+<br />
Not reversed 15–74 population Graduates of tertiary education<br />
(% 15–74 population)<br />
Original variable in<br />
relative terms<br />
Eurostat – EU Labour<br />
Force Survey<br />
Tertiary students in the fields of<br />
Education, Health and Welfare,<br />
Humanities and Art – ISCED 5–6<br />
Tertiary students in the fields<br />
+<br />
Not reversed Tertiary students of Education, Health and Welfare,<br />
Humanities and Art – ISCED 5–6<br />
(% tertiary students)<br />
Population with<br />
tertiary level of<br />
education attained –<br />
ISCED 5–6<br />
(% 15–74 population)<br />
Eurostat – UNESCO/<br />
OECD/Eurostat (UOE)<br />
questionnaires on<br />
Educational Statistics<br />
People participating in<br />
<strong>for</strong>mal or non-<strong>for</strong>mal<br />
education and training<br />
People participating in <strong>for</strong>mal<br />
+<br />
Not reversed 15–74 population or non-<strong>for</strong>mal education and<br />
training (% 15–74 population)<br />
Original variable in<br />
relative terms<br />
Eurostat – EU Labour<br />
Force Survey<br />
40 <strong>Gender</strong> <strong>Equality</strong> <strong>Index</strong> – <strong>Report</strong>