Gender Equality Index Report - European Institute for Gender ...
Gender Equality Index Report - European Institute for Gender ...
Gender Equality Index Report - European Institute for Gender ...

Create successful ePaper yourself
Turn your PDF publications into a flip-book with our unique Google optimized e-Paper software.
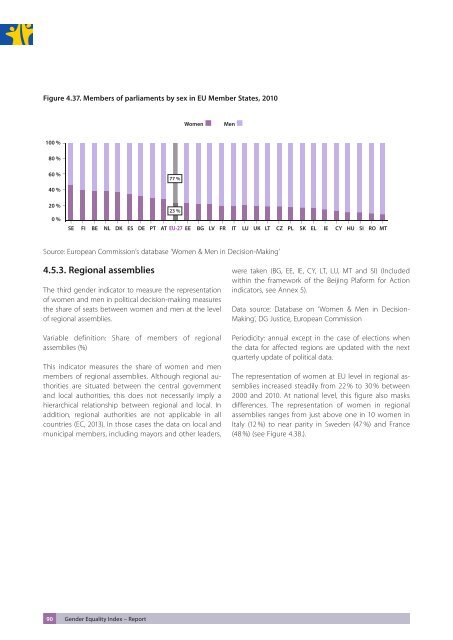
Figure 4.37. Members of parliaments by sex in EU Member States, 2010<br />
Women<br />
Men<br />
100 %<br />
80 %<br />
60 %<br />
77 %<br />
40 %<br />
20 %<br />
0 %<br />
23 %<br />
SE FI BE NL DK ES DE PT AT EU-27 EE BG LV FR IT LU UK LT CZ PL SK EL IE CY HU SI RO MT<br />
Source: <strong>European</strong> Commission’s database ‘Women & Men in Decision-Making’<br />
4.5.3. Regional assemblies<br />
The third gender indicator to measure the representation<br />
of women and men in political decision-making measures<br />
the share of seats between women and men at the level<br />
of regional assemblies.<br />
Variable definition: Share of members of regional<br />
assemblies (%)<br />
This indicator measures the share of women and men<br />
members of regional assemblies. Although regional authorities<br />
are situated between the central government<br />
and local authorities, this does not necessarily imply a<br />
hierarchical relationship between regional and local. In<br />
addition, regional authorities are not applicable in all<br />
countries (EC, 2013). In those cases the data on local and<br />
municipal members, including mayors and other leaders,<br />
were taken (BG, EE, IE, CY, LT, LU, MT and SI) (Included<br />
within the framework of the Beijing Pla<strong>for</strong>m <strong>for</strong> Action<br />
indicators, see Annex 5).<br />
Data source: Database on ‘Women & Men in Decision-<br />
Making’, DG Justice, <strong>European</strong> Commission<br />
Periodicity: annual except in the case of elections when<br />
the data <strong>for</strong> affected regions are updated with the next<br />
quarterly update of political data.<br />
The representation of women at EU level in regional assemblies<br />
increased steadily from 22 % to 30 % between<br />
2000 and 2010. At national level, this figure also masks<br />
differences. The representation of women in regional<br />
assemblies ranges from just above one in 10 women in<br />
Italy (12 %) to near parity in Sweden (47 %) and France<br />
(48 %) (see Figure 4.38.).<br />
90 <strong>Gender</strong> <strong>Equality</strong> <strong>Index</strong> – <strong>Report</strong>