Embedding R in Windows applications, and executing R remotely
Embedding R in Windows applications, and executing R remotely
Embedding R in Windows applications, and executing R remotely
Create successful ePaper yourself
Turn your PDF publications into a flip-book with our unique Google optimized e-Paper software.
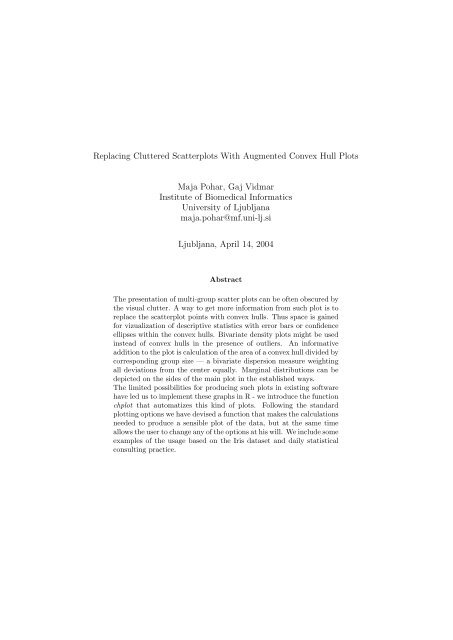
Replac<strong>in</strong>g Cluttered Scatterplots With Augmented Convex Hull Plots<br />
Maja Pohar, Gaj Vidmar<br />
Institute of Biomedical Informatics<br />
University of Ljubljana<br />
maja.pohar@mf.uni-lj.si<br />
Ljubljana, April 14, 2004<br />
Abstract<br />
The presentation of multi-group scatter plots can be often obscured by<br />
the visual clutter. A way to get more <strong>in</strong>formation from such plot is to<br />
replace the scatterplot po<strong>in</strong>ts with convex hulls. Thus space is ga<strong>in</strong>ed<br />
for vizualization of descriptive statistics with error bars or confidence<br />
ellipses with<strong>in</strong> the convex hulls. Bivariate density plots might be used<br />
<strong>in</strong>stead of convex hulls <strong>in</strong> the presence of outliers. An <strong>in</strong>formative<br />
addition to the plot is calculation of the area of a convex hull divided by<br />
correspond<strong>in</strong>g group size — a bivariate dispersion measure weight<strong>in</strong>g<br />
all deviations from the center equally. Marg<strong>in</strong>al distributions can be<br />
depicted on the sides of the ma<strong>in</strong> plot <strong>in</strong> the established ways.<br />
The limited possibilities for produc<strong>in</strong>g such plots <strong>in</strong> exist<strong>in</strong>g software<br />
have led us to implement these graphs <strong>in</strong> R - we <strong>in</strong>troduce the function<br />
chplot that automatizes this k<strong>in</strong>d of plots. Follow<strong>in</strong>g the st<strong>and</strong>ard<br />
plott<strong>in</strong>g options we have devised a function that makes the calculations<br />
needed to produce a sensible plot of the data, but at the same time<br />
allows the user to change any of the options at his will. We <strong>in</strong>clude some<br />
examples of the usage based on the Iris dataset <strong>and</strong> daily statistical<br />
consult<strong>in</strong>g practice.


