Embedding R in Windows applications, and executing R remotely
Embedding R in Windows applications, and executing R remotely
Embedding R in Windows applications, and executing R remotely
You also want an ePaper? Increase the reach of your titles
YUMPU automatically turns print PDFs into web optimized ePapers that Google loves.
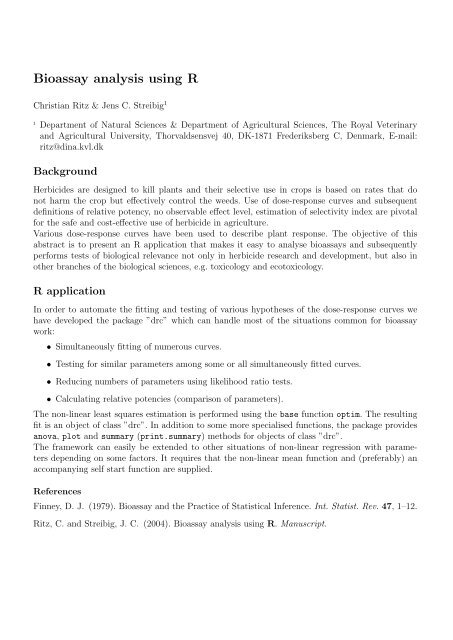
Bioassay analysis us<strong>in</strong>g R<br />
Christian Ritz & Jens C. Streibig 1<br />
1<br />
Department of Natural Sciences & Department of Agricultural Sciences, The Royal Veter<strong>in</strong>ary<br />
<strong>and</strong> Agricultural University, Thorvaldsensvej 40, DK-1871 Frederiksberg C, Denmark, E-mail:<br />
ritz@d<strong>in</strong>a.kvl.dk<br />
Background<br />
Herbicides are designed to kill plants <strong>and</strong> their selective use <strong>in</strong> crops is based on rates that do<br />
not harm the crop but effectively control the weeds. Use of dose-response curves <strong>and</strong> subsequent<br />
def<strong>in</strong>itions of relative potency, no observable effect level, estimation of selectivity <strong>in</strong>dex are pivotal<br />
for the safe <strong>and</strong> cost-effective use of herbicide <strong>in</strong> agriculture.<br />
Various dose-response curves have been used to describe plant response. The objective of this<br />
abstract is to present an R application that makes it easy to analyse bioassays <strong>and</strong> subsequently<br />
performs tests of biological relevance not only <strong>in</strong> herbicide research <strong>and</strong> development, but also <strong>in</strong><br />
other branches of the biological sciences, e.g. toxicology <strong>and</strong> ecotoxicology.<br />
R application<br />
In order to automate the fitt<strong>in</strong>g <strong>and</strong> test<strong>in</strong>g of various hypotheses of the dose-response curves we<br />
have developed the package ”drc” which can h<strong>and</strong>le most of the situations common for bioassay<br />
work:<br />
• Simultaneously fitt<strong>in</strong>g of numerous curves.<br />
• Test<strong>in</strong>g for similar parameters among some or all simultaneously fitted curves.<br />
• Reduc<strong>in</strong>g numbers of parameters us<strong>in</strong>g likelihood ratio tests.<br />
• Calculat<strong>in</strong>g relative potencies (comparison of parameters).<br />
The non-l<strong>in</strong>ear least squares estimation is performed us<strong>in</strong>g the base function optim. The result<strong>in</strong>g<br />
fit is an object of class ”drc”. In addition to some more specialised functions, the package provides<br />
anova, plot <strong>and</strong> summary (pr<strong>in</strong>t.summary) methods for objects of class ”drc”.<br />
The framework can easily be extended to other situations of non-l<strong>in</strong>ear regression with parameters<br />
depend<strong>in</strong>g on some factors. It requires that the non-l<strong>in</strong>ear mean function <strong>and</strong> (preferably) an<br />
accompany<strong>in</strong>g self start function are supplied.<br />
References<br />
F<strong>in</strong>ney, D. J. (1979). Bioassay <strong>and</strong> the Practice of Statistical Inference. Int. Statist. Rev. 47, 1–12.<br />
Ritz, C. <strong>and</strong> Streibig, J. C. (2004). Bioassay analysis us<strong>in</strong>g R. Manuscript.


