Embedding R in Windows applications, and executing R remotely
Embedding R in Windows applications, and executing R remotely
Embedding R in Windows applications, and executing R remotely

You also want an ePaper? Increase the reach of your titles
YUMPU automatically turns print PDFs into web optimized ePapers that Google loves.
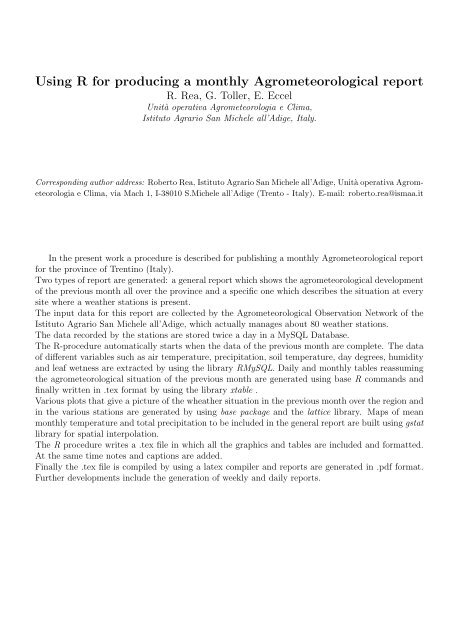
Us<strong>in</strong>g R for produc<strong>in</strong>g a monthly Agrometeorological report<br />
R. Rea, G. Toller, E. Eccel<br />
Unità operativa Agrometeorologia e Clima,<br />
Istituto Agrario San Michele all’Adige, Italy.<br />
Correspond<strong>in</strong>g author address: Roberto Rea, Istituto Agrario San Michele all’Adige, Unità operativa Agrometeorologia<br />
e Clima, via Mach 1, I-38010 S.Michele all’Adige (Trento - Italy). E-mail: roberto.rea@ismaa.it<br />
In the present work a procedure is described for publish<strong>in</strong>g a monthly Agrometeorological report<br />
for the prov<strong>in</strong>ce of Trent<strong>in</strong>o (Italy).<br />
Two types of report are generated: a general report which shows the agrometeorological development<br />
of the previous month all over the prov<strong>in</strong>ce <strong>and</strong> a specific one which describes the situation at every<br />
site where a weather stations is present.<br />
The <strong>in</strong>put data for this report are collected by the Agrometeorological Observation Network of the<br />
Istituto Agrario San Michele all’Adige, which actually manages about 80 weather stations.<br />
The data recorded by the stations are stored twice a day <strong>in</strong> a MySQL Database.<br />
The R-procedure automatically starts when the data of the previous month are complete. The data<br />
of different variables such as air temperature, precipitation, soil temperature, day degrees, humidity<br />
<strong>and</strong> leaf wetness are extracted by us<strong>in</strong>g the library RMySQL. Daily <strong>and</strong> monthly tables reassum<strong>in</strong>g<br />
the agrometeorological situation of the previous month are generated us<strong>in</strong>g base R comm<strong>and</strong>s <strong>and</strong><br />
f<strong>in</strong>ally written <strong>in</strong> .tex format by us<strong>in</strong>g the library xtable .<br />
Various plots that give a picture of the wheather situation <strong>in</strong> the previous month over the region <strong>and</strong><br />
<strong>in</strong> the various stations are generated by us<strong>in</strong>g base package <strong>and</strong> the lattice library. Maps of mean<br />
monthly temperature <strong>and</strong> total precipitation to be <strong>in</strong>cluded <strong>in</strong> the general report are built us<strong>in</strong>g gstat<br />
library for spatial <strong>in</strong>terpolation.<br />
The R procedure writes a .tex file <strong>in</strong> which all the graphics <strong>and</strong> tables are <strong>in</strong>cluded <strong>and</strong> formatted.<br />
At the same time notes <strong>and</strong> captions are added.<br />
F<strong>in</strong>ally the .tex file is compiled by us<strong>in</strong>g a latex compiler <strong>and</strong> reports are generated <strong>in</strong> .pdf format.<br />
Further developments <strong>in</strong>clude the generation of weekly <strong>and</strong> daily reports.