Embedding R in Windows applications, and executing R remotely
Embedding R in Windows applications, and executing R remotely
Embedding R in Windows applications, and executing R remotely
Create successful ePaper yourself
Turn your PDF publications into a flip-book with our unique Google optimized e-Paper software.
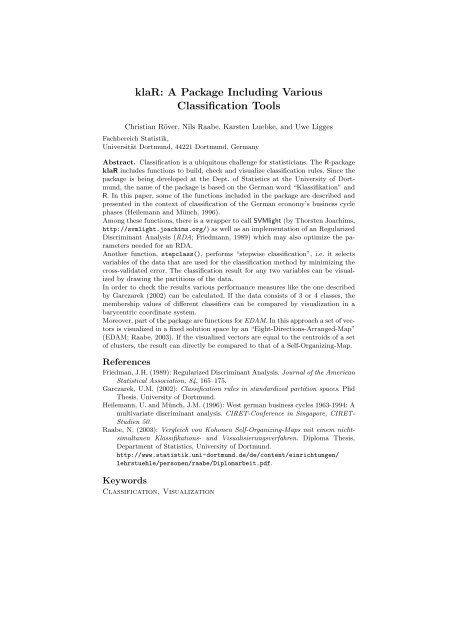
klaR: A Package Includ<strong>in</strong>g Various<br />
Classification Tools<br />
Christian Röver, Nils Raabe, Karsten Luebke, <strong>and</strong> Uwe Ligges<br />
Fachbereich Statistik,<br />
Universität Dortmund, 44221 Dortmund, Germany<br />
Abstract. Classification is a ubiquitous challenge for statisticians. The R-package<br />
klaR <strong>in</strong>cludes functions to build, check <strong>and</strong> visualize classification rules. S<strong>in</strong>ce the<br />
package is be<strong>in</strong>g developed at the Dept. of Statistics at the University of Dortmund,<br />
the name of the package is based on the German word “Klassifikation” <strong>and</strong><br />
R. In this paper, some of the functions <strong>in</strong>cluded <strong>in</strong> the package are described <strong>and</strong><br />
presented <strong>in</strong> the context of classification of the German economy’s bus<strong>in</strong>ess cycle<br />
phases (Heilemann <strong>and</strong> Münch, 1996).<br />
Among these functions, there is a wrapper to call SVMlight (by Thorsten Joachims,<br />
http://svmlight.joachims.org/) as well as an implementation of an Regularized<br />
Discrim<strong>in</strong>ant Analysis (RDA; Friedmann, 1989) which may also optimize the parameters<br />
needed for an RDA.<br />
Another function, stepclass(), performs “stepwise classification”, i.e. it selects<br />
variables of the data that are used for the classification method by m<strong>in</strong>imiz<strong>in</strong>g the<br />
cross-validated error. The classification result for any two variables can be visualized<br />
by draw<strong>in</strong>g the partitions of the data.<br />
In order to check the results various performance measures like the one described<br />
by Garczarek (2002) can be calculated. If the data consists of 3 or 4 classes, the<br />
membership values of different classifiers can be compared by visualization <strong>in</strong> a<br />
barycentric coord<strong>in</strong>ate system.<br />
Moreover, part of the package are functions for EDAM. In this approach a set of vectors<br />
is visualized <strong>in</strong> a fixed solution space by an “Eight-Directions-Arranged-Map”<br />
(EDAM; Raabe, 2003). If the visualized vectors are equal to the centroids of a set<br />
of clusters, the result can directly be compared to that of a Self-Organiz<strong>in</strong>g-Map.<br />
References<br />
Friedman, J.H. (1989): Regularized Discrim<strong>in</strong>ant Analysis. Journal of the American<br />
Statistical Association, 84, 165–175.<br />
Garczarek, U.M. (2002): Classification rules <strong>in</strong> st<strong>and</strong>ardized partition spaces. Phd<br />
Thesis, University of Dortmund.<br />
Heilemann, U. <strong>and</strong> Münch, J.M. (1996): West german bus<strong>in</strong>ess cycles 1963-1994: A<br />
multivariate discrim<strong>in</strong>ant analysis. CIRET-Conference <strong>in</strong> S<strong>in</strong>gapore, CIRET-<br />
Studien 50.<br />
Raabe, N. (2003): Vergleich von Kohonen Self-Organiz<strong>in</strong>g-Maps mit e<strong>in</strong>em nichtsimultanen<br />
Klassifikations- und Visualisierungsverfahren. Diploma Thesis,<br />
Department of Statistics, University of Dortmund.<br />
http://www.statistik.uni-dortmund.de/de/content/e<strong>in</strong>richtungen/<br />
lehrstuehle/personen/raabe/Diplomarbeit.pdf.<br />
Keywords<br />
Classification, Visualization


