The Green Line and the Security Fence:
The Green Line and the Security Fence:
The Green Line and the Security Fence:

Create successful ePaper yourself
Turn your PDF publications into a flip-book with our unique Google optimized e-Paper software.
20<br />
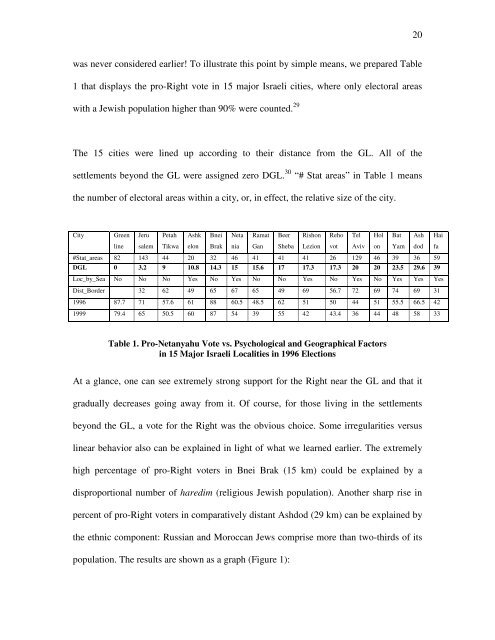
was never considered earlier! To illustrate this point by simple means, we prepared Table<br />
1 that displays <strong>the</strong> pro-Right vote in 15 major Israeli cities, where only electoral areas<br />
with a Jewish population higher than 90% were counted. 29<br />
<strong>The</strong> 15 cities were lined up according to <strong>the</strong>ir distance from <strong>the</strong> GL. All of <strong>the</strong><br />
settlements beyond <strong>the</strong> GL were assigned zero DGL. 30 “# Stat areas” in Table 1 means<br />
<strong>the</strong> number of electoral areas within a city, or, in effect, <strong>the</strong> relative size of <strong>the</strong> city.<br />
City <strong>Green</strong><br />
line<br />
Jeru<br />
salem<br />
Petah<br />
Tikwa<br />
Ashk<br />
elon<br />
Bnei<br />
Brak<br />
Neta<br />
nia<br />
Ramat<br />
Gan<br />
Beer<br />
Sheba<br />
Rishon<br />
Lezion<br />
Reho<br />
vot<br />
Tel<br />
Aviv<br />
Hol<br />
on<br />
Bat<br />
Yam<br />
Ash<br />
dod<br />
Hai<br />
fa<br />
#Stat_areas 82 143 44 20 32 46 41 41 41 26 129 46 39 36 59<br />
DGL 0 3.2 9 10.8 14.3 15 15.6 17 17.3 17.3 20 20 23.5 29.6 39<br />
Loc_by_Sea No No No Yes No Yes No No Yes No Yes No Yes Yes Yes<br />
Dist_Border 32 62 49 65 67 65 49 69 56.7 72 69 74 69 31<br />
1996 87.7 71 57.6 61 88 60.5 48.5 62 51 50 44 51 55.5 66.5 42<br />
1999 79.4 65 50.5 60 87 54 39 55 42 43.4 36 44 48 58 33<br />
Table 1. Pro-Netanyahu Vote vs. Psychological <strong>and</strong> Geographical Factors<br />
in 15 Major Israeli Localities in 1996 Elections<br />
At a glance, one can see extremely strong support for <strong>the</strong> Right near <strong>the</strong> GL <strong>and</strong> that it<br />
gradually decreases going away from it. Of course, for those living in <strong>the</strong> settlements<br />
beyond <strong>the</strong> GL, a vote for <strong>the</strong> Right was <strong>the</strong> obvious choice. Some irregularities versus<br />
linear behavior also can be explained in light of what we learned earlier. <strong>The</strong> extremely<br />
high percentage of pro-Right voters in Bnei Brak (15 km) could be explained by a<br />
disproportional number of haredim (religious Jewish population). Ano<strong>the</strong>r sharp rise in<br />
percent of pro-Right voters in comparatively distant Ashdod (29 km) can be explained by<br />
<strong>the</strong> ethnic component: Russian <strong>and</strong> Moroccan Jews comprise more than two-thirds of its<br />
population. <strong>The</strong> results are shown as a graph (Figure 1):