The Green Line and the Security Fence:
The Green Line and the Security Fence:
The Green Line and the Security Fence:

Create successful ePaper yourself
Turn your PDF publications into a flip-book with our unique Google optimized e-Paper software.
32<br />
Category Variables B S.E. Wald Sig. Exp(B)<br />
Socio-<br />
Demography<br />
Cars_1999<br />
Child_Family<br />
Child_Army<br />
Acad_Degree<br />
Age<br />
Gender<br />
Religiosity<br />
Years_in_Israel<br />
.290<br />
-.044<br />
-.052<br />
-.006<br />
.007<br />
-.233<br />
.322<br />
.007<br />
.094<br />
.050<br />
.113<br />
.091<br />
.007<br />
.140<br />
.093<br />
.005<br />
9.626<br />
.801<br />
.214<br />
.004<br />
1.023<br />
2.783<br />
12.136<br />
1.909<br />
.002<br />
.371<br />
.644<br />
.949<br />
.312<br />
.095<br />
.000<br />
.167<br />
1.337<br />
.957<br />
.949<br />
.994<br />
1.007<br />
.792<br />
1.380<br />
1.007<br />
Psychology DGL -.083 .009 89.267 .000 .920<br />
Geography DB -.020 .006 12.151 .001 .980<br />
Constant 1.392 .422 10.876 .001 4.023<br />
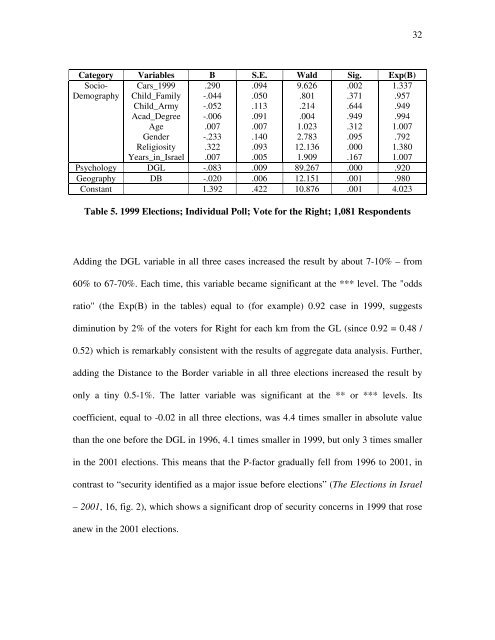
Table 5. 1999 Elections; Individual Poll; Vote for <strong>the</strong> Right; 1,081 Respondents<br />
Adding <strong>the</strong> DGL variable in all three cases increased <strong>the</strong> result by about 7-10% – from<br />
60% to 67-70%. Each time, this variable became significant at <strong>the</strong> *** level. <strong>The</strong> "odds<br />
ratio" (<strong>the</strong> Exp(B) in <strong>the</strong> tables) equal to (for example) 0.92 case in 1999, suggests<br />
diminution by 2% of <strong>the</strong> voters for Right for each km from <strong>the</strong> GL (since 0.92 = 0.48 /<br />
0.52) which is remarkably consistent with <strong>the</strong> results of aggregate data analysis. Fur<strong>the</strong>r,<br />
adding <strong>the</strong> Distance to <strong>the</strong> Border variable in all three elections increased <strong>the</strong> result by<br />
only a tiny 0.5-1%. <strong>The</strong> latter variable was significant at <strong>the</strong> ** or *** levels. Its<br />
coefficient, equal to -0.02 in all three elections, was 4.4 times smaller in absolute value<br />
than <strong>the</strong> one before <strong>the</strong> DGL in 1996, 4.1 times smaller in 1999, but only 3 times smaller<br />
in <strong>the</strong> 2001 elections. This means that <strong>the</strong> P-factor gradually fell from 1996 to 2001, in<br />
contrast to “security identified as a major issue before elections” (<strong>The</strong> Elections in Israel<br />
– 2001, 16, fig. 2), which shows a significant drop of security concerns in 1999 that rose<br />
anew in <strong>the</strong> 2001 elections.