Doc_Post Tsunami GDA-NAD (Eng-UNEP).pdf - Wetlands ...
Doc_Post Tsunami GDA-NAD (Eng-UNEP).pdf - Wetlands ...
Doc_Post Tsunami GDA-NAD (Eng-UNEP).pdf - Wetlands ...

You also want an ePaper? Increase the reach of your titles
YUMPU automatically turns print PDFs into web optimized ePapers that Google loves.
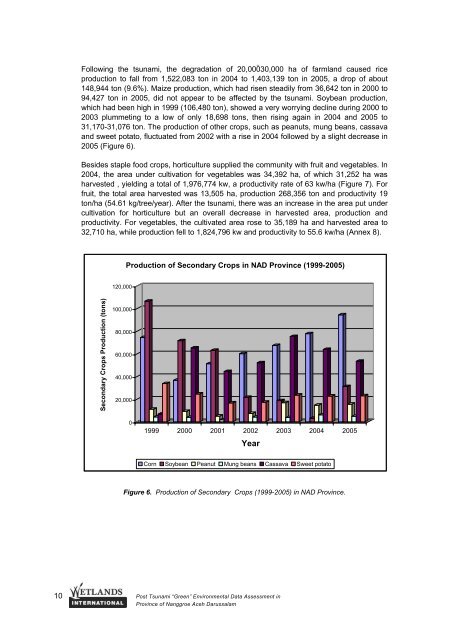
Following the tsunami, the degradation of 20,00030,000 ha of farmland caused rice<br />
production to fall from 1,522,083 ton in 2004 to 1,403,139 ton in 2005, a drop of about<br />
148,944 ton (9.6%). Maize production, which had risen steadily from 36,642 ton in 2000 to<br />
94,427 ton in 2005, did not appear to be affected by the tsunami. Soybean production,<br />
which had been high in 1999 (106,480 ton), showed a very worrying decline during 2000 to<br />
2003 plummeting to a low of only 18,698 tons, then rising again in 2004 and 2005 to<br />
31,170-31,076 ton. The production of other crops, such as peanuts, mung beans, cassava<br />
and sweet potato, fluctuated from 2002 with a rise in 2004 followed by a slight decrease in<br />
2005 (Figure 6).<br />
Besides staple food crops, horticulture supplied the community with fruit and vegetables. In<br />
2004, the area under cultivation for vegetables was 34,392 ha, of which 31,252 ha was<br />
harvested , yielding a total of 1,976,774 kw, a productivity rate of 63 kw/ha (Figure 7). For<br />
fruit, the total area harvested was 13,505 ha, production 268,356 ton and productivity 19<br />
ton/ha (54.61 kg/tree/year). After the tsunami, there was an increase in the area put under<br />
cultivation for horticulture but an overall decrease in harvested area, production and<br />
productivity. For vegetables, the cultivated area rose to 35,189 ha and harvested area to<br />
32,710 ha, while production fell to 1,824,796 kw and productivity to 55.6 kw/ha (Annex 8).<br />
Production of Secondary Crops in <strong>NAD</strong> Province (1999-2005)<br />
120,000<br />
Secondary Crops Production (tons)<br />
100,000<br />
80,000<br />
60,000<br />
40,000<br />
20,000<br />
0<br />
1999 2000 2001 2002 2003 2004 2005<br />
Year<br />
Corn Soybean Peanut Mung beans Cassava Sweet potato<br />
Figure 6. Production of Secondary Crops (1999-2005) in <strong>NAD</strong> Province.<br />
10 <strong>Post</strong> <strong>Tsunami</strong> “Green” Environmental Data Assessment in<br />
Province of Nanggroe Aceh Darussalam