Annual Report 2005 (60 pages / 1.3MB) - JAL | JAPAN AIRLINES
Annual Report 2005 (60 pages / 1.3MB) - JAL | JAPAN AIRLINES
Annual Report 2005 (60 pages / 1.3MB) - JAL | JAPAN AIRLINES

You also want an ePaper? Increase the reach of your titles
YUMPU automatically turns print PDFs into web optimized ePapers that Google loves.
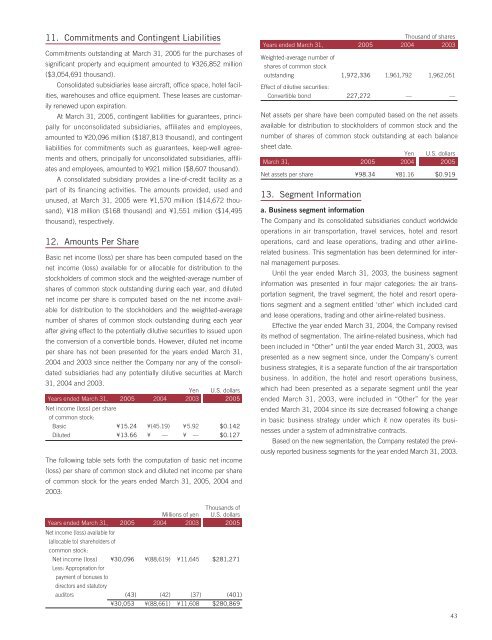
11. Commitments and Contingent Liabilities<br />
Commitments outstanding at March 31, <strong>2005</strong> for the purchases of<br />
significant property and equipment amounted to ¥326,852 million<br />
($3,054,691 thousand).<br />
Consolidated subsidiaries lease aircraft, office space, hotel facilities,<br />
warehouses and office equipment. These leases are customarily<br />
renewed upon expiration.<br />
At March 31, <strong>2005</strong>, contingent liabilities for guarantees, principally<br />
for unconsolidated subsidiaries, affiliates and employees,<br />
amounted to ¥20,096 million ($187,813 thousand), and contingent<br />
liabilities for commitments such as guarantees, keep-well agreements<br />
and others, principally for unconsolidated subsidiaries, affiliates<br />
and employees, amounted to ¥921 million ($8,<strong>60</strong>7 thousand).<br />
A consolidated subsidiary provides a line-of-credit facility as a<br />
part of its financing activities. The amounts provided, used and<br />
unused, at March 31, <strong>2005</strong> were ¥1,570 million ($14,672 thousand),<br />
¥18 million ($168 thousand) and ¥1,551 million ($14,495<br />
thousand), respectively.<br />
12. Amounts Per Share<br />
Basic net income (loss) per share has been computed based on the<br />
net income (loss) available for or allocable for distribution to the<br />
stockholders of common stock and the weighted-average number of<br />
shares of common stock outstanding during each year, and diluted<br />
net income per share is computed based on the net income available<br />
for distribution to the stockholders and the weighted-average<br />
number of shares of common stock outstanding during each year<br />
after giving effect to the potentially dilutive securities to issued upon<br />
the conversion of a convertible bonds. However, diluted net income<br />
per share has not been presented for the years ended March 31,<br />
2004 and 2003 since neither the Company nor any of the consolidated<br />
subsidiaries had any potentially dilutive securities at March<br />
31, 2004 and 2003.<br />
Yen U.S. dollars<br />
Years ended March 31, <strong>2005</strong> 2004 2003 <strong>2005</strong><br />
Net income (loss) per share<br />
of common stock:<br />
Basic ¥15.24 ¥(45.19) ¥5.92 $0.142<br />
Diluted ¥13.66 ¥ — ¥ — $0.127<br />
The following table sets forth the computation of basic net income<br />
(loss) per share of common stock and diluted net income per share<br />
of common stock for the years ended March 31, <strong>2005</strong>, 2004 and<br />
2003:<br />
Millions of yen<br />
Years ended March 31, <strong>2005</strong> 2004 2003<br />
Net income (loss) available for<br />
(allocable to) shareholders of<br />
common stock:<br />
Thousands of<br />
U.S. dollars<br />
<strong>2005</strong><br />
Net income (loss) ¥30,096 ¥(88,619) ¥11,645 $281,271<br />
Less: Appropriation for<br />
payment of bonuses to<br />
directors and statutory<br />
auditors (43) (42) (37) (401)<br />
¥30,053 ¥(88,661) ¥11,<strong>60</strong>8 $280,869<br />
Thousand of shares<br />
Years ended March 31, <strong>2005</strong> 2004 2003<br />
Weighted-average number of<br />
shares of common stock<br />
outstanding 1,972,336 1,961,792 1,962,051<br />
Effect of dilutive securities:<br />
Convertible bond 227,272 — —<br />
Net assets per share have been computed based on the net assets<br />
available for distribution to stockholders of common stock and the<br />
number of shares of common stock outstanding at each balance<br />
sheet date.<br />
Yen U.S. dollars<br />
March 31, <strong>2005</strong> 2004 <strong>2005</strong><br />
Net assets per share ¥98.34 ¥81.16 $0.919<br />
13. Segment Information<br />
a. Business segment information<br />
The Company and its consolidated subsidiaries conduct worldwide<br />
operations in air transportation, travel services, hotel and resort<br />
operations, card and lease operations, trading and other airlinerelated<br />
business. This segmentation has been determined for internal<br />
management purposes.<br />
Until the year ended March 31, 2003, the business segment<br />
information was presented in four major categories: the air transportation<br />
segment, the travel segment, the hotel and resort operations<br />
segment and a segment entitled ‘other’ which included card<br />
and lease operations, trading and other airline-related business.<br />
Effective the year ended March 31, 2004, the Company revised<br />
its method of segmentation. The airline-related business, which had<br />
been included in “Other” until the year ended March 31, 2003, was<br />
presented as a new segment since, under the Company’s current<br />
business strategies, it is a separate function of the air transportation<br />
business. In addition, the hotel and resort operations business,<br />
which had been presented as a separate segment until the year<br />
ended March 31, 2003, were included in “Other” for the year<br />
ended March 31, 2004 since its size decreased following a change<br />
in basic business strategy under which it now operates its businesses<br />
under a system of administrative contracts.<br />
Based on the new segmentation, the Company restated the previously<br />
reported business segments for the year ended March 31, 2003.<br />
43