Annual Report 2005 (60 pages / 1.3MB) - JAL | JAPAN AIRLINES
Annual Report 2005 (60 pages / 1.3MB) - JAL | JAPAN AIRLINES
Annual Report 2005 (60 pages / 1.3MB) - JAL | JAPAN AIRLINES

You also want an ePaper? Increase the reach of your titles
YUMPU automatically turns print PDFs into web optimized ePapers that Google loves.
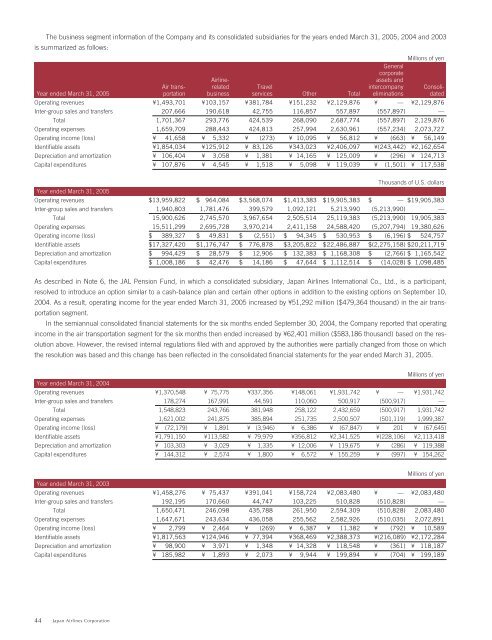
The business segment information of the Company and its consolidated subsidiaries for the years ended March 31, <strong>2005</strong>, 2004 and 2003<br />
is summarized as follows:<br />
Millions of yen<br />
General<br />
corporate<br />
Airline-<br />
assets and<br />
Air trans- related Travel intercompany Consoli-<br />
Year ended March 31, <strong>2005</strong> portation business services Other Total eliminations dated<br />
Operating revenues ¥1,493,701 ¥103,157 ¥381,784 ¥151,232 ¥2,129,876 ¥ — ¥2,129,876<br />
Inter-group sales and transfers 207,666 190,618 42,755 116,857 557,897 (557,897) —<br />
Total 1,701,367 293,776 424,539 268,090 2,687,774 (557,897) 2,129,876<br />
Operating expenses 1,659,709 288,443 424,813 257,994 2,630,961 (557,234) 2,073,727<br />
Operating income (loss) ¥ 41,658 ¥ 5,332 ¥ (273) ¥ 10,095 ¥ 56,812 ¥ (663) ¥ 56,149<br />
Identifiable assets ¥1,854,034 ¥125,912 ¥ 83,126 ¥343,023 ¥2,406,097 ¥(243,442) ¥2,162,654<br />
Depreciation and amortization ¥ 106,404 ¥ 3,058 ¥ 1,381 ¥ 14,165 ¥ 125,009 ¥ (296) ¥ 124,713<br />
Capital expenditures ¥ 107,876 ¥ 4,545 ¥ 1,518 ¥ 5,098 ¥ 119,039 ¥ (1,501) ¥ 117,538<br />
Thousands of U.S. dollars<br />
Year ended March 31, <strong>2005</strong><br />
Operating revenues $13,959,822 $ 964,084 $3,568,074 $1,413,383 $19,905,383 $ — $19,905,383<br />
Inter-group sales and transfers 1,940,803 1,781,476 399,579 1,092,121 5,213,990 (5,213,990) —<br />
Total 15,900,626 2,745,570 3,967,654 2,505,514 25,119,383 (5,213,990) 19,905,383<br />
Operating expenses 15,511,299 2,695,728 3,970,214 2,411,158 24,588,420 (5,207,794) 19,380,626<br />
Operating income (loss) $ 389,327 $ 49,831 $ (2,551) $ 94,345 $ 530,953 $ (6,196) $ 524,757<br />
Identifiable assets $17,327,420 $1,176,747 $ 776,878 $3,205,822 $22,486,887 $(2,275,158) $20,211,719<br />
Depreciation and amortization $ 994,429 $ 28,579 $ 12,906 $ 132,383 $ 1,168,308 $ (2,766) $ 1,165,542<br />
Capital expenditures $ 1,008,186 $ 42,476 $ 14,186 $ 47,644 $ 1,112,514 $ (14,028) $ 1,098,485<br />
As described in Note 6, the <strong>JAL</strong> Pension Fund, in which a consolidated subsidiary, Japan Airlines International Co., Ltd., is a participant,<br />
resolved to introduce an option similar to a cash-balance plan and certain other options in addition to the existing options on September 10,<br />
2004. As a result, operating income for the year ended March 31, <strong>2005</strong> increased by ¥51,292 million ($479,364 thousand) in the air transportation<br />
segment.<br />
In the semiannual consolidated financial statements for the six months ended September 30, 2004, the Company reported that operating<br />
income in the air transportation segment for the six months then ended increased by ¥62,401 million ($583,186 thousand) based on the resolution<br />
above. However, the revised internal regulations filed with and approved by the authorities were partially changed from those on which<br />
the resolution was based and this change has been reflected in the consolidated financial statements for the year ended March 31, <strong>2005</strong>.<br />
Millions of yen<br />
Year ended March 31, 2004<br />
Operating revenues ¥1,370,548 ¥ 75,775 ¥337,356 ¥148,061 ¥1,931,742 ¥ — ¥1,931,742<br />
Inter-group sales and transfers 178,274 167,991 44,591 110,0<strong>60</strong> 500,917 (500,917) —<br />
Total 1,548,823 243,766 381,948 258,122 2,432,659 (500,917) 1,931,742<br />
Operating expenses 1,621,002 241,875 385,894 251,735 2,500,507 (501,119) 1,999,387<br />
Operating income (loss) ¥ (72,179) ¥ 1,891 ¥ (3,946) ¥ 6,386 ¥ (67,847) ¥ 201 ¥ (67,645)<br />
Identifiable assets ¥1,791,150 ¥113,582 ¥ 79,979 ¥356,812 ¥2,341,525 ¥(228,106) ¥2,113,418<br />
Depreciation and amortization ¥ 103,303 ¥ 3,029 ¥ 1,335 ¥ 12,006 ¥ 119,675 ¥ (286) ¥ 119,388<br />
Capital expenditures ¥ 144,312 ¥ 2,574 ¥ 1,800 ¥ 6,572 ¥ 155,259 ¥ (997) ¥ 154,262<br />
Millions of yen<br />
Year ended March 31, 2003<br />
Operating revenues ¥1,458,276 ¥ 75,437 ¥391,041 ¥158,724 ¥2,083,480 ¥ — ¥2,083,480<br />
Inter-group sales and transfers 192,195 170,6<strong>60</strong> 44,747 103,225 510,828 (510,828) —<br />
Total 1,650,471 246,098 435,788 261,950 2,594,309 (510,828) 2,083,480<br />
Operating expenses 1,647,671 243,634 436,058 255,562 2,582,926 (510,035) 2,072,891<br />
Operating income (loss) ¥ 2,799 ¥ 2,464 ¥ (269) ¥ 6,387 ¥ 11,382 ¥ (792) ¥ 10,589<br />
Identifiable assets ¥1,817,563 ¥124,946 ¥ 77,394 ¥368,469 ¥2,388,373 ¥(216,089) ¥2,172,284<br />
Depreciation and amortization ¥ 98,900 ¥ 3,971 ¥ 1,348 ¥ 14,328 ¥ 118,548 ¥ (361) ¥ 118,187<br />
Capital expenditures ¥ 185,982 ¥ 1,893 ¥ 2,073 ¥ 9,944 ¥ 199,894 ¥ (704) ¥ 199,189<br />
44 Japan Airlines Corporation