
Create successful ePaper yourself
Turn your PDF publications into a flip-book with our unique Google optimized e-Paper software.
L. D. PETERSEN, F. K. DUENNEBIER, T. H. SHIPLEY<br />
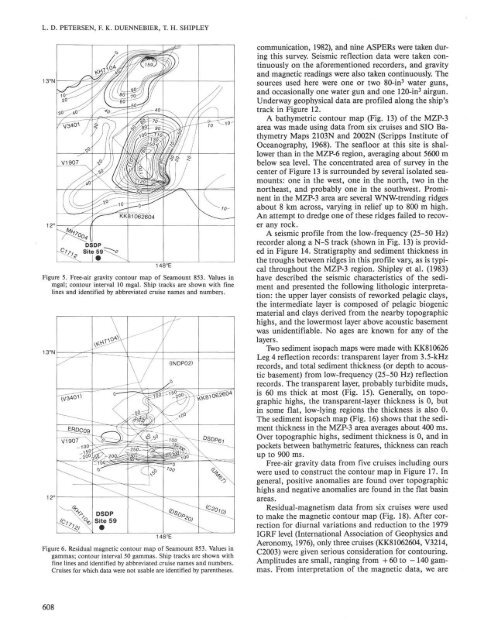
13°N<br />
148°E<br />
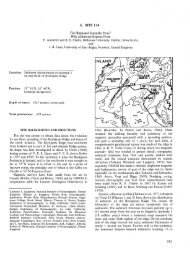
Figure 5. Free-air gravity contour map of <strong>Sea</strong>mount 853. Values in<br />
mgal; contour interval 10 mgal. Ship tracks are shown with fine<br />
lines and identified by abbreviated cruise names and numbers.<br />
13°N<br />
148°E<br />
Figure 6. Residual magnetic contour map of <strong>Sea</strong>mount 853. Values in<br />
gammas; contour interval 50 gammas. Ship tracks are shown with<br />
fine lines and identified by abbreviated cruise names and numbers.<br />
Cruises for which data were not usable are identified by parentheses.<br />
608<br />
communication, 1982), and nine ASPERs were taken during<br />
this survey. Seismic reflection data were taken continuously<br />
on the aforementioned recorders, and gravity<br />
and magnetic readings were also taken continuously. The<br />
sources used here were one or two 80-in 3 water guns,<br />
and occasionally one water gun and one 120-in 3 airgun.<br />
Underway geophysical data are profiled along the ship's<br />
track in Figure 12.<br />
A bathymetric contour map (Fig. 13) of the MZP-3<br />
area was made using data from six cruises and SIO Bathymetry<br />
Maps 2103N and 2002N (Scripps Institute of<br />
Oceanography, 1968). The seafloor at this site is shallower<br />
than in the MZP-6 region, averaging about 5600 m<br />
below sea level. The concentrated area of survey in the<br />
center of Figure 13 is surrounded by several isolated seamounts:<br />
one in the west, one in the north, two in the<br />
northeast, and probably one in the southwest. Prominent<br />
in the MZP-3 area are several WNW-trending ridges<br />
about 8 km across, varying in relief up to 800 m high.<br />
An attempt to dredge one of these ridges failed to recover<br />
any rock.<br />
A seismic profile from the low-frequency (25-50 Hz)<br />
recorder along a N-S track (shown in Fig. 13) is provided<br />
in Figure 14. Stratigraphy and sediment thickness in<br />
the troughs between ridges in this profile vary, as is typical<br />
throughout the MZP-3 region. Shipley et al. (1983)<br />
have described the seismic characteristics of the sediment<br />
and presented the following lithologic interpretation:<br />
the upper layer consists of reworked pelagic clays,<br />
the intermediate layer is composed of pelagic biogenic<br />
material and clays derived from the nearby topographic<br />
highs, and the lowermost layer above acoustic basement<br />
was unidentifiable. No ages are known for any of the<br />
layers.<br />
Two sediment isopach maps were made with KK810626<br />
Leg 4 reflection records: transparent layer from 3.5-kHz<br />
records, and total sediment thickness (or depth to acoustic<br />
basement) from low-frequency (25-50 Hz) reflection<br />
records. The transparent layer, probably turbidite muds,<br />
is 60 ms thick at most (Fig. 15). Generally, on topographic<br />
highs, the transparent-layer thickness is 0, but<br />
in some flat, low-lying regions the thickness is also 0.<br />
The sediment isopach map (Fig. 16) shows that the sediment<br />
thickness in the MZP-3 area averages about 400 ms.<br />
Over topographic highs, sediment thickness is 0, and in<br />
pockets between bathymetric features, thickness can reach<br />
up to 900 ms.<br />
Free-air gravity data from five cruises including ours<br />
were used to construct the contour map in Figure 17. In<br />
general, positive anomalies are found over topographic<br />
highs and negative anomalies are found in the flat basin<br />
areas.<br />
Residual-magnetism data from six cruises were used<br />
to make the magnetic contour map (Fig. 18). After correction<br />
for diurnal variations and reduction to the 1979<br />
IGRF level (International Association of Geophysics and<br />
Aeronomy, 1976), only three cruises (KK81062604, V3214,<br />
C2003) were given serious consideration for contouring.<br />
Amplitudes are small, ranging from + 60 to - 140 gammas.<br />
From interpretation of the magnetic data, we are