Creating high-resolution hail datasets using social media and post ...
Creating high-resolution hail datasets using social media and post ...
Creating high-resolution hail datasets using social media and post ...

You also want an ePaper? Increase the reach of your titles
YUMPU automatically turns print PDFs into web optimized ePapers that Google loves.
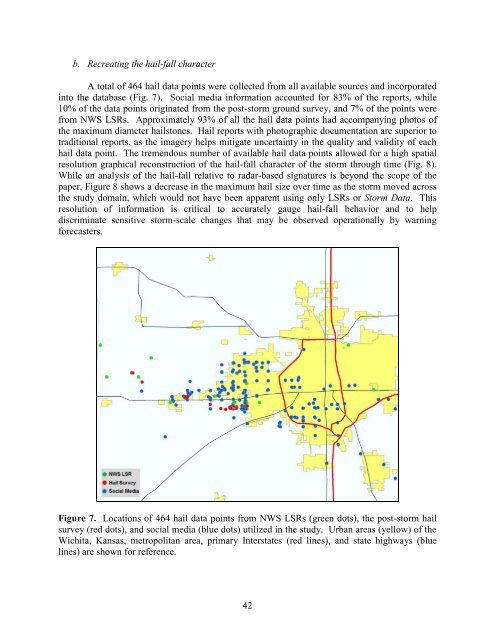
. Recreating the <strong>hail</strong>-fall character<br />
A total of 464 <strong>hail</strong> data points were collected from all available sources <strong>and</strong> incorporated<br />
into the database (Fig. 7). Social <strong>media</strong> information accounted for 83% of the reports, while<br />
10% of the data points originated from the <strong>post</strong>-storm ground survey, <strong>and</strong> 7% of the points were<br />
from NWS LSRs. Approximately 93% of all the <strong>hail</strong> data points had accompanying photos of<br />
the maximum diameter <strong>hail</strong>stones. Hail reports with photographic documentation are superior to<br />
traditional reports, as the imagery helps mitigate uncertainty in the quality <strong>and</strong> validity of each<br />
<strong>hail</strong> data point. The tremendous number of available <strong>hail</strong> data points allowed for a <strong>high</strong> spatial<br />
<strong>resolution</strong> graphical reconstruction of the <strong>hail</strong>-fall character of the storm through time (Fig. 8).<br />
While an analysis of the <strong>hail</strong>-fall relative to radar-based signatures is beyond the scope of the<br />
paper, Figure 8 shows a decrease in the maximum <strong>hail</strong> size over time as the storm moved across<br />
the study domain, which would not have been apparent <strong>using</strong> only LSRs or Storm Data. This<br />
<strong>resolution</strong> of information is critical to accurately gauge <strong>hail</strong>-fall behavior <strong>and</strong> to help<br />
discriminate sensitive storm-scale changes that may be observed operationally by warning<br />
forecasters.<br />
Figure 7. Locations of 464 <strong>hail</strong> data points from NWS LSRs (green dots), the <strong>post</strong>-storm <strong>hail</strong><br />
survey (red dots), <strong>and</strong> <strong>social</strong> <strong>media</strong> (blue dots) utilized in the study. Urban areas (yellow) of the<br />
Wichita, Kansas, metropolitan area, primary Interstates (red lines), <strong>and</strong> state <strong>high</strong>ways (blue<br />
lines) are shown for reference.<br />
42