Introduction to Numerical Math and Matlab ... - Ohio University
Introduction to Numerical Math and Matlab ... - Ohio University
Introduction to Numerical Math and Matlab ... - Ohio University

Create successful ePaper yourself
Turn your PDF publications into a flip-book with our unique Google optimized e-Paper software.
20 LAB 7. SYMBOLIC COMPUTATIONS<br />
cos(x 5 )<br />
1<br />
0.5<br />
0<br />
−0.5<br />
−1<br />
−6 −4 −2 0 2 4 6<br />
x<br />
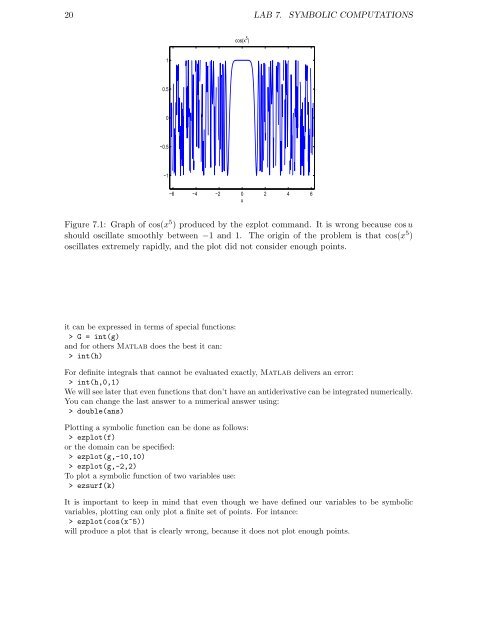
Figure 7.1: Graph of cos(x 5 ) produced by the ezplot comm<strong>and</strong>. It is wrong because cos u<br />
should oscillate smoothly between −1 <strong>and</strong> 1. The origin of the problem is that cos(x 5 )<br />
oscillates extremely rapidly, <strong>and</strong> the plot did not consider enough points.<br />
it can be expressed in terms of special functions:<br />
> G = int(g)<br />
<strong>and</strong> for others <strong>Matlab</strong> does the best it can:<br />
> int(h)<br />
For definite integrals that cannot be evaluated exactly, <strong>Matlab</strong> delivers an error:<br />
> int(h,0,1)<br />
We will see later that even functions that don’t have an antiderivative can be integrated numerically.<br />
You can change the last answer <strong>to</strong> a numerical answer using:<br />
> double(ans)<br />
Plotting a symbolic function can be done as follows:<br />
> ezplot(f)<br />
or the domain can be specified:<br />
> ezplot(g,-10,10)<br />
> ezplot(g,-2,2)<br />
To plot a symbolic function of two variables use:<br />
> ezsurf(k)<br />
It is important <strong>to</strong> keep in mind that even though we have defined our variables <strong>to</strong> be symbolic<br />
variables, plotting can only plot a finite set of points. For intance:<br />
> ezplot(cos(x^5))<br />
will produce a plot that is clearly wrong, because it does not plot enough points.