Introduction to Numerical Math and Matlab ... - Ohio University
Introduction to Numerical Math and Matlab ... - Ohio University
Introduction to Numerical Math and Matlab ... - Ohio University

Create successful ePaper yourself
Turn your PDF publications into a flip-book with our unique Google optimized e-Paper software.
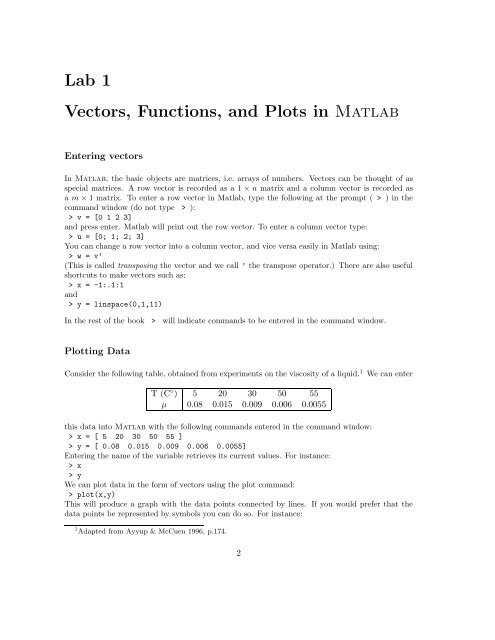
Lab 1<br />
Vec<strong>to</strong>rs, Functions, <strong>and</strong> Plots in <strong>Matlab</strong><br />
Entering vec<strong>to</strong>rs<br />
In <strong>Matlab</strong>, the basic objects are matrices, i.e. arrays of numbers. Vec<strong>to</strong>rs can be thought of as<br />
special matrices. A row vec<strong>to</strong>r is recorded as a 1 × n matrix <strong>and</strong> a column vec<strong>to</strong>r is recorded as<br />
a m × 1 matrix. To enter a row vec<strong>to</strong>r in <strong>Matlab</strong>, type the following at the prompt ( > ) in the<br />
comm<strong>and</strong> window (do not type > ):<br />
> v = [0 1 2 3]<br />
<strong>and</strong> press enter. <strong>Matlab</strong> will print out the row vec<strong>to</strong>r. To enter a column vec<strong>to</strong>r type:<br />
> u = [0; 1; 2; 3]<br />
You can change a row vec<strong>to</strong>r in<strong>to</strong> a column vec<strong>to</strong>r, <strong>and</strong> vice versa easily in <strong>Matlab</strong> using:<br />
> w = v’<br />
(This is called transposing the vec<strong>to</strong>r <strong>and</strong> we call ’ the transpose opera<strong>to</strong>r.) There are also useful<br />
shortcuts <strong>to</strong> make vec<strong>to</strong>rs such as:<br />
> x = -1:.1:1<br />
<strong>and</strong><br />
> y = linspace(0,1,11)<br />
In the rest of the book > will indicate comm<strong>and</strong>s <strong>to</strong> be entered in the comm<strong>and</strong> window.<br />
Plotting Data<br />
Consider the following table, obtained from experiments on the viscosity of a liquid. 1 We can enter<br />
T (C ◦ ) 5 20 30 50 55<br />
µ 0.08 0.015 0.009 0.006 0.0055<br />
this data in<strong>to</strong> <strong>Matlab</strong> with the following comm<strong>and</strong>s entered in the comm<strong>and</strong> window:<br />
> x = [ 5 20 30 50 55 ]<br />
> y = [ 0.08 0.015 0.009 0.006 0.0055]<br />
Entering the name of the variable retrieves its current values. For instance:<br />
> x<br />
> y<br />
We can plot data in the form of vec<strong>to</strong>rs using the plot comm<strong>and</strong>:<br />
> plot(x,y)<br />
This will produce a graph with the data points connected by lines. If you would prefer that the<br />
data points be represented by symbols you can do so. For instance:<br />
1 Adapted from Ayyup & McCuen 1996, p.174.<br />
2