Radiation Transport Around Kerr Black Holes Jeremy David ...
Radiation Transport Around Kerr Black Holes Jeremy David ...
Radiation Transport Around Kerr Black Holes Jeremy David ...

You also want an ePaper? Increase the reach of your titles
YUMPU automatically turns print PDFs into web optimized ePapers that Google loves.
º¾ßÖÝÐØÙÖÚ׸×ÔØÖÒÐÙÑÒÓ×ØÝØ ¾<br />
64 CHAPTER 2. RAY-TRACING IN THE KERR METRIC<br />
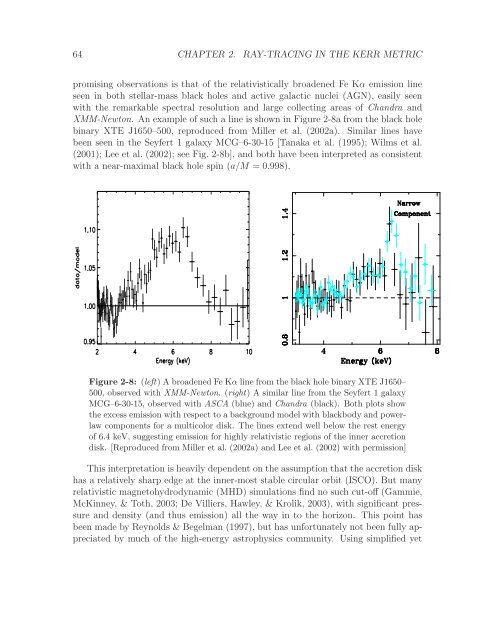
promising observations is that of the relativistically broadened Fe Kα emission line<br />
seen in both stellar-mass black holes and active galactic nuclei (AGN), easily seen<br />
with the remarkable spectral resolution and large collecting areas of Chandra and<br />
XMM-Newton. An example of such a line is shown in Figure 2-8a from the black hole<br />
binary XTE J1650–500, reproduced from Miller et al. (2002a). Similar lines have<br />
been seen in the Seyfert 1 galaxy MCG–6-30-15 [Tanaka et al. (1995); Wilms et al.<br />
(2001); Lee et al. (2002); see Fig. 2-8b], and both have been interpreted as consistent<br />
with a near-maximal black hole spin (a/M = 0.998).<br />
×ÑÖÒÐÒÙ×ØÖ×ÔÓÒ×ÑØÖ×ÓØØØÓÖ×ÖÙÒÖØÒºÌ× ÚÒÒÖÝÖ×ÓÐÙØÓÒÓÓÒÐÝÏÀŽ¾ÎØ뵺ÌÖÓÒ «×ØÙ×ÓÒÙ×ÒÊÌÒÒ×Ù«ÖÓØÙ×ØÒÖÝÖ×ÓÐÙØÓÒ ×ÐÓÝÒÔÓÛÖßÐÛÓÑÔÓÒÒØ×´ÅÐÐÖØк¾¼¼¾µºÆÓØØÒÓÒ¹ Ù××Ò×ÔÒÐÓÛ¹ÒÖÝÜØÒØÓØÐÒÔÖӬк ºººØ»ÑÓÐÖØÓÓÖ̽¼¼ß¼¼ºÌÑÓÐÓÒ××Ø×ÓÑÙÐØÓÐÓÖ ¢ <br />
¦<br />
Ò×ØÖÙÑÒØ×ÒÙ×ØÓ×ØÑØØÛØ×ÓØÐÒ׸ÙØÐÑ×ØØÐÒ×<br />
Ò³ØÒØк¾¼¼¾µÒ̽¼·¼´Ò³ØÒØк¾¼¼¾µÓÛÚÖØ× Øк¾¼¼½ÆÓÛØк¾¼¼¾µº ëºÖÓÐÒÔÖÓ¬Ð×´ßεÚÒÓ×ÖÚÓÖ˽½½ºß¿¼ ÒÖ×ÓÐÚÒØÓÑÙÐØÔÐÓÑÔÓÒÒØ××ÓÙÐØÖØÛØÖ×ÖÚºËÓÑÖÓÒ<br />
ÖÓ¬Ð×ÖÖØÖ×ÝÑÑØÖÒÑÝÑÓÖÔÖÓÙØÓÓÑÔØÓÒ×ØØÖÒ ÙÖ²ÙÖ¾¼¼¼µÌ½߾´ÅÐÐÖØк¾¼¼½µÒ¿¿ß´Ò ÈßËÈØØÓÖ×ÓÖÔÔÓ˸ÛÚÖ×ÓÐÙØÓÒÓ¼ÎØ «×ÓÙÖ×ØØÚÒ×ØÙÛØÊÌÒÐÙÊǽ߼´ÐÙÒ×ß<br />
ÒÖÐØÚ×ØÖÓÒÒºÔÔÓË×ØÙ×ÚÐ×ÓÖÚÐÓØÖ×Ý×ØÑ× ØÖÓ¸×ÝÑÑØÖëÐÒÔÖÓ¬Ð×ØجØØÐÐÓÖÖÐØÚ×Ø×ÑÖÒ Ê˽½·½¼´ÅÖØÓØк¾¼¼¾µÒνËÖ´ÅÐÐÖØк¾¼¼¾µº ÅÓÖØÐÐÒ×ØÙ×ÓØëÐÒÚÒÚÙ×ÒØÅËÒ<br />
¢«<br />
Figure 2-8: (left) A broadened Fe Kα line from the black hole binary XTE J1650–<br />
500, observed with XMM-Newton. (right) A similar line from the Seyfert 1 galaxy<br />
MCG–6-30-15, observed with ASCA (blue) and Chandra (black). Both plots show<br />
the excess emission with respect to a background model with blackbody and powerlaw<br />
components for a multicolor disk. The lines extend well below the rest energy<br />
of 6.4 keV, suggesting emission for highly relativistic regions of the inner accretion<br />
ÒØÖ×ØÒÐݸÓÖÓØ×Ý×ØÑ×ØÒÒÖ×ÖÙ×ÙÖÓÑØÐÒÔÖÓ¬Ð×<br />
disk. [Reproduced from Miller et al. (2002a) and Lee et al. (2002) with permission]<br />
ÓÒ××ØÒØÛØØÑÖÒÐÐÝ×ØÐÖÙÐÖÓÖØÓËÛÖÞ×ÐÀºÃÖÖ ÅÅßÆÛØÓÒÒÒÖºÍ×ÒØÓÖÑÖÓ×ÖÚØÓÖݳ×ÈÁßÅÇ˽ØØÓÖ¸ ØÖ×ÒÓØÖÕÙÖº<br />
This interpretation is heavily dependent on the assumption that the accretion disk<br />
ÊÒØÐݸÖ×ÙÐØ×Ó×ØÙ×ØÖÖ×ÓÐÙØÓÒÚÔÔÖØØÑÙ×Ó<br />
has a relatively sharp edge at the inner-most stable circular orbit (ISCO). But many<br />
relativistic magnetohydrodynamic (MHD) simulations find no such cut-off (Gammie,<br />
McKinney, & Toth, 2003; De Villiers, Hawley, & Krolik, 2003), with significant pressure<br />
and density (and thus emission) all the way in to the horizon. This point has<br />
been made by Reynolds & Begelman (1997), but has unfortunately not been fully appreciated<br />
by much of the high-energy astrophysics community. Using simplified yet<br />
<br />
is attributed to the relativistically broadened Fe K«emission.<br />
. 3.— The iron K«emission profile from the long (4.5 day) ASCA ob-