Numerical simulation of the heat transfer in amorphous ... - Physics
Numerical simulation of the heat transfer in amorphous ... - Physics
Numerical simulation of the heat transfer in amorphous ... - Physics

You also want an ePaper? Increase the reach of your titles
YUMPU automatically turns print PDFs into web optimized ePapers that Google loves.
Rev. Sci. Instrum., Vol. 74, No. 10, October 2003<br />
Simulation <strong>of</strong> membrane calorimeter<br />
4401<br />
c s,sim for various ratios k 2D,s /k 2D,m between 10 and 5<br />
10 6 . As before, we def<strong>in</strong>e c s,sim c tot (layer 2)<br />
c tot (layer 1) where c tot P/T for each layer, and <strong>the</strong> error<br />
is def<strong>in</strong>ed as (c s,<strong>the</strong>ory c s,sim )/c s,<strong>the</strong>ory . This systematic<br />
error takes <strong>in</strong>to account errors produced both by <strong>the</strong> deviations<br />
from a s<strong>in</strong>gle time constant caused by low <strong>in</strong>ternal<br />
<strong>the</strong>rmal conductivity and <strong>the</strong> shifts <strong>in</strong> fractional contribution<br />
<strong>of</strong> <strong>the</strong> membrane border on <strong>in</strong>creas<strong>in</strong>g <strong>the</strong> sample <strong>heat</strong> capacity<br />
<strong>in</strong> <strong>the</strong> standard difference method technique. In <strong>the</strong><br />
high ratio limit (510 6 ), this systematic error varies between<br />
3% and 0% for values <strong>of</strong> c 2D,s /c 2D,m rang<strong>in</strong>g from 0.5<br />
to 10. Consider<strong>in</strong>g more physical <strong>the</strong>rmal conductivity ratios,<br />
k 2D,s /k 2D,m 100– 400, <strong>the</strong> derivative rema<strong>in</strong>s small for<br />
physically relevant values <strong>of</strong> c 2D,s /c 2D,m rang<strong>in</strong>g from 0.5 to<br />
10, hence, <strong>the</strong> error rema<strong>in</strong>s below a few %. In <strong>the</strong> limit <strong>of</strong><br />
large c 2D,s /c 2D,m (10), where Fig. 10 showed <strong>the</strong> derivative<br />
dX/d(c 2D,s /c 2D,m ) is high even for relatively high <strong>in</strong>temal<br />
<strong>the</strong>rmal conductivity k 2D,s /k 2D,m 100– 400, <strong>the</strong> fractional<br />
contribution <strong>of</strong> <strong>the</strong> membrane will change significantly<br />
on add<strong>in</strong>g <strong>the</strong> sample e.g., X goes from 20% to 10% on<br />
add<strong>in</strong>g a sample which has c 2D,s /c 2D,m 100). However, <strong>the</strong><br />
error <strong>in</strong>troduced <strong>in</strong>to <strong>the</strong> determ<strong>in</strong>ation <strong>of</strong> c s by <strong>the</strong> differential<br />
method is none<strong>the</strong>less very small as seen <strong>in</strong> Fig. 12 as<br />
<strong>the</strong> total contribution <strong>of</strong> <strong>the</strong> membrane is small compared to<br />
<strong>the</strong> sample.<br />
Thus, <strong>the</strong> relaxation method is only exact <strong>in</strong> <strong>the</strong> limit <strong>of</strong><br />
large k 2D,s /k 2D,m and large c 2D,s /c 2D,m . The errors <strong>in</strong>troduced<br />
as ei<strong>the</strong>r is reduced, however, partially cancel <strong>in</strong> <strong>the</strong><br />
usual differential method <strong>of</strong> measurement <strong>in</strong> which <strong>the</strong><br />
sample <strong>heat</strong> capacity is determ<strong>in</strong>ed from <strong>the</strong> difference between<br />
<strong>the</strong> <strong>heat</strong> capacity <strong>of</strong> a device with a conduction layer<br />
and a similar device with conduction layer plus sample. Under<br />
our standard operat<strong>in</strong>g conditions <strong>of</strong> k 2D,s /k 2D,m 100,<br />
and c 2D,s /c 2D,m between 1 and 10 Cu conduction layer plus<br />
sample, <strong>the</strong> error is 2% or less, and would, <strong>the</strong>refore, likely<br />
be dom<strong>in</strong>ated by o<strong>the</strong>r errors <strong>in</strong> <strong>the</strong> measurement, such as<br />
uncerta<strong>in</strong>ty <strong>in</strong> sample thickness. Even for relatively low ratios<br />
<strong>of</strong> k 2D,s /k 2D,m e.g. 10, <strong>the</strong> error is below 7% for all<br />
reasonable values <strong>of</strong> c 2D,s /c 2D,m , largely because <strong>of</strong> <strong>the</strong><br />
compensat<strong>in</strong>g effects <strong>of</strong> <strong>the</strong> differential method.<br />
In all cases where <strong>the</strong> systematic error is large, deviations<br />
from s<strong>in</strong>gle exponential decay are also seen, i.e., <strong>the</strong><br />
normalized residual becomes larger than <strong>the</strong> background<br />
noise <strong>of</strong> <strong>the</strong> <strong>simulation</strong> that is controlled by <strong>the</strong> absolute<br />
tolerance see Figs. 8c and 9. Figure 9 shows <strong>the</strong> deviation<br />
from a pure exponential as a function <strong>of</strong> k 2D,s /k 2D,m and<br />
c 2D,s /c 2D,m ; <strong>the</strong>se data nearly perfectly parallel <strong>the</strong> dependence<br />
<strong>of</strong> systematic errors shown <strong>in</strong> Fig. 12. However, <strong>the</strong><br />
deviation is not as large as perhaps might be expected e.g.,<br />
even data for <strong>the</strong> bare membrane shown <strong>in</strong> Fig. 5 could be<br />
qualitatively and mistakenly viewed as exponential, and<br />
could be masked experimentally by noise; it is, <strong>the</strong>refore,<br />
important to verify that <strong>the</strong> membrane-based devices are<br />
used <strong>in</strong> limits where systematic errors are calculated to be<br />
small, based on estimates <strong>of</strong> k 2D,s /k 2D,m and c 2D,s /c 2D,m .<br />
C. Analysis <strong>of</strong> th<strong>in</strong> Cr film sample<br />
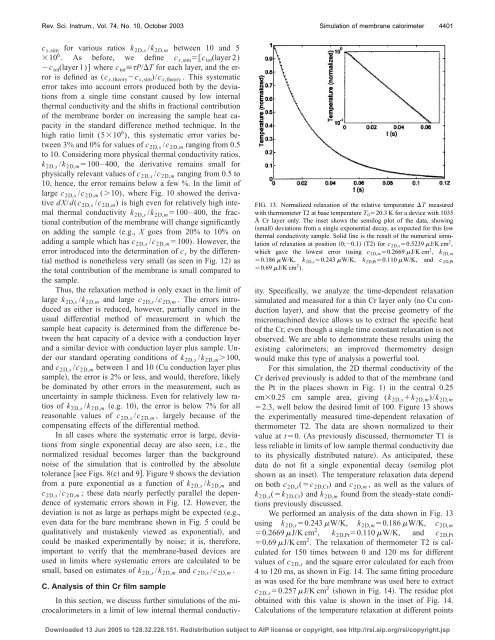
FIG. 13. Normalized relaxation <strong>of</strong> <strong>the</strong> relative temperature T measured<br />
with <strong>the</strong>rmometer T2 at base temperature T 0 20.3 K for a device with 1035<br />
Å Cr layer only. The <strong>in</strong>set shows <strong>the</strong> semilog plot <strong>of</strong> <strong>the</strong> data, show<strong>in</strong>g<br />
small deviations from a s<strong>in</strong>gle exponential decay, as expected for this low<br />
<strong>the</strong>rmal conductivity sample. Solid l<strong>in</strong>e is <strong>the</strong> result <strong>of</strong> <strong>the</strong> numerical <strong>simulation</strong><br />
<strong>of</strong> relaxation at position 0;0.1 T2 for c 2D,s 0.5239 J/K cm 2 ,<br />
which gave <strong>the</strong> lowest error us<strong>in</strong>g c 2D,m 0.2669 J/K cm 2 , k 2D,m<br />
0.186 W/K, k 2D,s 0.243 W/K, k 2D,Pt 0.110 W/K, and c 2D,Pt<br />
0.69 J/K cm 2 ).<br />
In this section, we discuss fur<strong>the</strong>r <strong>simulation</strong>s <strong>of</strong> <strong>the</strong> microcalorimeters<br />
<strong>in</strong> a limit <strong>of</strong> low <strong>in</strong>ternal <strong>the</strong>rmal conductivity.<br />
Specifically, we analyze <strong>the</strong> time-dependent relaxation<br />
simulated and measured for a th<strong>in</strong> Cr layer only no Cu conduction<br />
layer, and show that <strong>the</strong> precise geometry <strong>of</strong> <strong>the</strong><br />
micromach<strong>in</strong>ed device allows us to extract <strong>the</strong> specific <strong>heat</strong><br />
<strong>of</strong> <strong>the</strong> Cr, even though a s<strong>in</strong>gle time constant relaxation is not<br />
observed. We are able to demonstrate <strong>the</strong>se results us<strong>in</strong>g <strong>the</strong><br />
exist<strong>in</strong>g calorimeters; an improved <strong>the</strong>rmometry design<br />
would make this type <strong>of</strong> analysis a powerful tool.<br />
For this <strong>simulation</strong>, <strong>the</strong> 2D <strong>the</strong>rmal conductivity <strong>of</strong> <strong>the</strong><br />
Cr derived previously is added to that <strong>of</strong> <strong>the</strong> membrane and<br />
<strong>the</strong> Pt <strong>in</strong> <strong>the</strong> places shown <strong>in</strong> Fig. 1 <strong>in</strong> <strong>the</strong> central 0.25<br />
cm0.25 cm sample area, giv<strong>in</strong>g (k 2D,s k 2D,m )/k 2D,m<br />
2.3, well below <strong>the</strong> desired limit <strong>of</strong> 100. Figure 13 shows<br />
<strong>the</strong> experimentally measured time-dependent relaxation <strong>of</strong><br />
<strong>the</strong>rmometer T2. The data are shown normalized to <strong>the</strong>ir<br />
value at t0. As previously discussed, <strong>the</strong>rmometer T1 is<br />
less reliable <strong>in</strong> limits <strong>of</strong> low sample <strong>the</strong>rmal conductivity due<br />
to its physically distributed nature. As anticipated, <strong>the</strong>se<br />
data do not fit a s<strong>in</strong>gle exponential decay semilog plot<br />
shown as an <strong>in</strong>set. The temperature relaxation data depend<br />
on both c 2D,s (c 2D,Cr ) and c 2D,m , as well as <strong>the</strong> values <strong>of</strong><br />
k 2D,s (k 2D,Cr ) and k 2D,m found from <strong>the</strong> steady-state conditions<br />
previously discussed.<br />
We performed an analysis <strong>of</strong> <strong>the</strong> data shown <strong>in</strong> Fig. 13<br />
us<strong>in</strong>g k 2D,s 0.243 W/K, k 2D,m 0.186 W/K, c 2D,m<br />
0.2669 J/K cm 2 , k 2D,Pt 0.110 W/K, and c 2D,Pt<br />
0.69 J/K cm 2 . The relaxation <strong>of</strong> <strong>the</strong>rmometer T2 is calculated<br />
for 150 times between 0 and 120 ms for different<br />
values <strong>of</strong> c 2D,s and <strong>the</strong> square error calculated for each from<br />
4 to 120 ms, as shown <strong>in</strong> Fig. 14. The same fitt<strong>in</strong>g procedure<br />
as was used for <strong>the</strong> bare membrane was used here to extract<br />
c 2D,s 0.257 J/K cm 2 shown <strong>in</strong> Fig. 14. The residue plot<br />
obta<strong>in</strong>ed with this value is shown <strong>in</strong> <strong>the</strong> <strong>in</strong>set <strong>of</strong> Fig. 14.<br />
Calculations <strong>of</strong> <strong>the</strong> temperature relaxation at different po<strong>in</strong>ts<br />
Downloaded 13 Jun 2005 to 128.32.228.151. Redistribution subject to AIP license or copyright, see http://rsi.aip.org/rsi/copyright.jsp