Numerical simulation of the heat transfer in amorphous ... - Physics
Numerical simulation of the heat transfer in amorphous ... - Physics
Numerical simulation of the heat transfer in amorphous ... - Physics

Create successful ePaper yourself
Turn your PDF publications into a flip-book with our unique Google optimized e-Paper software.
4394 Rev. Sci. Instrum., Vol. 74, No. 10, October 2003 Revaz et al.<br />
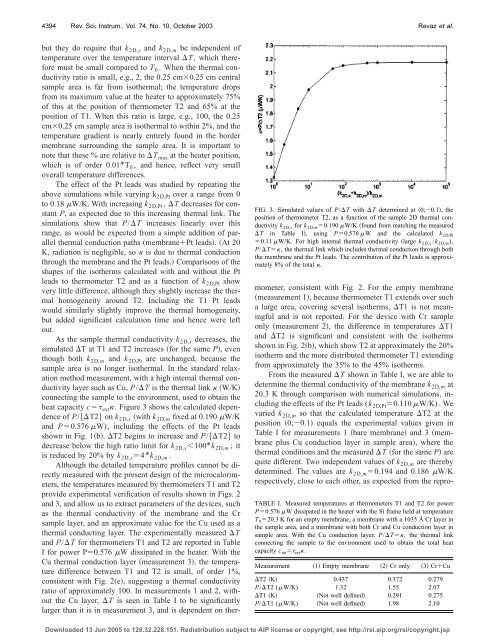
FIG. 3. Simulated values <strong>of</strong> P/T with T determ<strong>in</strong>ed at 0;0.1, <strong>the</strong><br />
position <strong>of</strong> <strong>the</strong>rmometer T2, as a function <strong>of</strong> <strong>the</strong> sample 2D <strong>the</strong>rmal conductivity<br />
k 2D,s for k 2D,m 0.190 W/K found from match<strong>in</strong>g <strong>the</strong> measured<br />
T <strong>in</strong> Table I, us<strong>in</strong>g P0.576 W and <strong>the</strong> calculated k 2D,Pt<br />
0.11 W/K. For high <strong>in</strong>temal <strong>the</strong>rmal conductivity large k 2D,s /k 2D,m ),<br />
P/T, <strong>the</strong> <strong>the</strong>rmal l<strong>in</strong>k which <strong>in</strong>cludes <strong>the</strong>rmal conduction through both<br />
<strong>the</strong> membrane and <strong>the</strong> Pt leads. The contribution <strong>of</strong> <strong>the</strong> Pt leads is approximately<br />
8% <strong>of</strong> <strong>the</strong> total .<br />
but <strong>the</strong>y do require that k 2D,s and k 2D,m be <strong>in</strong>dependent <strong>of</strong><br />
temperature over <strong>the</strong> temperature <strong>in</strong>terval T, which <strong>the</strong>refore<br />
must be small compared to T 0 . When <strong>the</strong> <strong>the</strong>rmal conductivity<br />
ratio is small, e.g., 2, <strong>the</strong> 0.25 cm0.25 cm central<br />
sample area is far from iso<strong>the</strong>rmal; <strong>the</strong> temperature drops<br />
from its maximum value at <strong>the</strong> <strong>heat</strong>er to approximately 75%<br />
<strong>of</strong> this at <strong>the</strong> position <strong>of</strong> <strong>the</strong>rmometer T2 and 65% at <strong>the</strong><br />
position <strong>of</strong> T1. When this ratio is large, e.g., 100, <strong>the</strong> 0.25<br />
cm0.25 cm sample area is iso<strong>the</strong>rmal to with<strong>in</strong> 2%, and <strong>the</strong><br />
temperature gradient is nearly entirely found <strong>in</strong> <strong>the</strong> border<br />
membrane surround<strong>in</strong>g <strong>the</strong> sample area. It is important to<br />
note that <strong>the</strong>se % are relative to T max at <strong>the</strong> <strong>heat</strong>er position,<br />
which is <strong>of</strong> order 0.01*T 0 , and hence, reflect very small<br />
overall temperature differences.<br />
The effect <strong>of</strong> <strong>the</strong> Pt leads was studied by repeat<strong>in</strong>g <strong>the</strong><br />
above <strong>simulation</strong>s while vary<strong>in</strong>g k 2D,Pt over a range from 0<br />
to 0.18 W/K. With <strong>in</strong>creas<strong>in</strong>g k 2D,Pt , T decreases for constant<br />
P, as expected due to this <strong>in</strong>creas<strong>in</strong>g <strong>the</strong>rmal l<strong>in</strong>k. The<br />
<strong>simulation</strong>s show that P/T <strong>in</strong>creases l<strong>in</strong>early over this<br />
range, as would be expected from a simple addition <strong>of</strong> parallel<br />
<strong>the</strong>rmal conduction paths membranePt leads. At 20<br />
K, radiation is negligible, so is due to <strong>the</strong>rmal conduction<br />
through <strong>the</strong> membrane and <strong>the</strong> Pt leads. Comparisons <strong>of</strong> <strong>the</strong><br />
shapes <strong>of</strong> <strong>the</strong> iso<strong>the</strong>rms calculated with and without <strong>the</strong> Pt<br />
leads to <strong>the</strong>rmometer T2 and as a function <strong>of</strong> k 2D,Pt show<br />
very little difference, although <strong>the</strong>y slightly <strong>in</strong>crease <strong>the</strong> <strong>the</strong>rmal<br />
homogeneity around T2. Includ<strong>in</strong>g <strong>the</strong> T1 Pt leads<br />
would similarly slightly improve <strong>the</strong> <strong>the</strong>rmal homogeneity,<br />
but added significant calculation time and hence were left<br />
out.<br />
As <strong>the</strong> sample <strong>the</strong>rmal conductivity k 2D,s decreases, <strong>the</strong><br />
simulated T at T1 and T2 <strong>in</strong>creases for <strong>the</strong> same P, even<br />
though both k 2D,m and k 2D,Pt are unchanged, because <strong>the</strong><br />
sample area is no longer iso<strong>the</strong>rmal. In <strong>the</strong> standard relaxation<br />
method measurement, with a high <strong>in</strong>temal <strong>the</strong>rmal conductivity<br />
layer such as Cu, P/T is <strong>the</strong> <strong>the</strong>rmal l<strong>in</strong>k W/K<br />
connect<strong>in</strong>g <strong>the</strong> sample to <strong>the</strong> environment, used to obta<strong>in</strong> <strong>the</strong><br />
<strong>heat</strong> capacity c ext . Figure 3 shows <strong>the</strong> calculated dependence<br />
<strong>of</strong> P/T2 on k 2D,s with k 2D,m fixed at 0.190 W/K<br />
and P0.576 W), <strong>in</strong>clud<strong>in</strong>g <strong>the</strong> effects <strong>of</strong> <strong>the</strong> Pt leads<br />
shown <strong>in</strong> Fig. 1b. T2 beg<strong>in</strong>s to <strong>in</strong>crease and P/T2 to<br />
decrease below <strong>the</strong> high ratio limit for k 2D,s 100*k 2D,m ;it<br />
is reduced by 20% by k 2D,s 4*k 2D,m .<br />
Although <strong>the</strong> detailed temperature pr<strong>of</strong>iles cannot be directly<br />
measured with <strong>the</strong> present design <strong>of</strong> <strong>the</strong> microcalorimeters,<br />
<strong>the</strong> temperatures measured by <strong>the</strong>rmometers T1 and T2<br />
provide experimental verification <strong>of</strong> results shown <strong>in</strong> Figs. 2<br />
and 3, and allow us to extract parameters <strong>of</strong> <strong>the</strong> devices, such<br />
as <strong>the</strong> <strong>the</strong>rmal conductivity <strong>of</strong> <strong>the</strong> membrane and <strong>the</strong> Cr<br />
sample layer, and an approximate value for <strong>the</strong> Cu used as a<br />
<strong>the</strong>rmal conduct<strong>in</strong>g layer. The experimentally measured T<br />
and P/T for <strong>the</strong>rmometers T1 and T2 are reported <strong>in</strong> Table<br />
I for power P0.576 W dissipated <strong>in</strong> <strong>the</strong> <strong>heat</strong>er. With <strong>the</strong><br />
Cu <strong>the</strong>rmal conduction layer measurement 3, <strong>the</strong> temperature<br />
difference between T1 and T2 is small, <strong>of</strong> order 1%,<br />
consistent with Fig. 2e, suggest<strong>in</strong>g a <strong>the</strong>rmal conductivity<br />
ratio <strong>of</strong> approximately 100. In measurements 1 and 2, without<br />
<strong>the</strong> Cu layer, T is seen <strong>in</strong> Table I to be significantly<br />
larger than it is <strong>in</strong> measurement 3, and is dependent on <strong>the</strong>rmometer,<br />
consistent with Fig. 2. For <strong>the</strong> empty membrane<br />
measurement 1, because <strong>the</strong>rmometer T1 extends over such<br />
a large area, cover<strong>in</strong>g several iso<strong>the</strong>rms, T1 is not mean<strong>in</strong>gful<br />
and is not reported. For <strong>the</strong> device with Cr sample<br />
only measurement 2, <strong>the</strong> difference <strong>in</strong> temperatures T1<br />
and T2 is significant and consistent with <strong>the</strong> iso<strong>the</strong>rms<br />
shown <strong>in</strong> Fig. 2b, which show T2 at approximately <strong>the</strong> 20%<br />
iso<strong>the</strong>rm and <strong>the</strong> more distributed <strong>the</strong>rmometer T1 extend<strong>in</strong>g<br />
from approximately <strong>the</strong> 35% to <strong>the</strong> 45% iso<strong>the</strong>rms.<br />
From <strong>the</strong> measured T shown <strong>in</strong> Table I, we are able to<br />
determ<strong>in</strong>e <strong>the</strong> <strong>the</strong>rmal conductivity <strong>of</strong> <strong>the</strong> membrane k 2D,m at<br />
20.3 K through comparison with numerical <strong>simulation</strong>s, <strong>in</strong>clud<strong>in</strong>g<br />
<strong>the</strong> effects <strong>of</strong> <strong>the</strong> Pt leads (k 2D,Pt 0.110 W/K). We<br />
varied k 2D,m so that <strong>the</strong> calculated temperature T2 at <strong>the</strong><br />
position 0;0.1 equals <strong>the</strong> experimental values given <strong>in</strong><br />
Table I for measurements 1 bare membrane and 3 membrane<br />
plus Cu conduction layer <strong>in</strong> sample area, where <strong>the</strong><br />
<strong>the</strong>rmal conditions and <strong>the</strong> measured T for <strong>the</strong> same P are<br />
quite different. Two <strong>in</strong>dependent values <strong>of</strong> k 2D,m are <strong>the</strong>reby<br />
determ<strong>in</strong>ed. The values are k 2D,m 0.194 and 0.186 W/K<br />
respectively, close to each o<strong>the</strong>r, as expected from <strong>the</strong> repro-<br />
TABLE I. Measured temperatures at <strong>the</strong>rmometers T1 and T2 for power<br />
P0.576 W dissipated <strong>in</strong> <strong>the</strong> <strong>heat</strong>er with <strong>the</strong> Si frame held at temperature<br />
T 0 20.3 K for an empty membrane, a membrane with a 1035 Å Cr layer <strong>in</strong><br />
<strong>the</strong> sample area, and a membrane with both Cr and Cu conduction layer <strong>in</strong><br />
sample area. With <strong>the</strong> Cu conduction layer, P/T, <strong>the</strong> <strong>the</strong>rmal l<strong>in</strong>k<br />
connect<strong>in</strong>g <strong>the</strong> sample to <strong>the</strong> environment used to obta<strong>in</strong> <strong>the</strong> total <strong>heat</strong><br />
capacity c tot ext .<br />
Measurement 1 Empty membrane 2 Cr only 3 CrCu<br />
T2 K 0.437 0.372 0.279<br />
P/T2 (W/K) 1.32 1.55 2.07<br />
T1 K Not well def<strong>in</strong>ed 0.291 0.275<br />
P/T1 (W/K) Not well def<strong>in</strong>ed 1.98 2.10<br />
Downloaded 13 Jun 2005 to 128.32.228.151. Redistribution subject to AIP license or copyright, see http://rsi.aip.org/rsi/copyright.jsp