Numerical simulation of the heat transfer in amorphous ... - Physics
Numerical simulation of the heat transfer in amorphous ... - Physics
Numerical simulation of the heat transfer in amorphous ... - Physics

You also want an ePaper? Increase the reach of your titles
YUMPU automatically turns print PDFs into web optimized ePapers that Google loves.
Rev. Sci. Instrum., Vol. 74, No. 10, October 2003<br />
Simulation <strong>of</strong> membrane calorimeter<br />
4397<br />
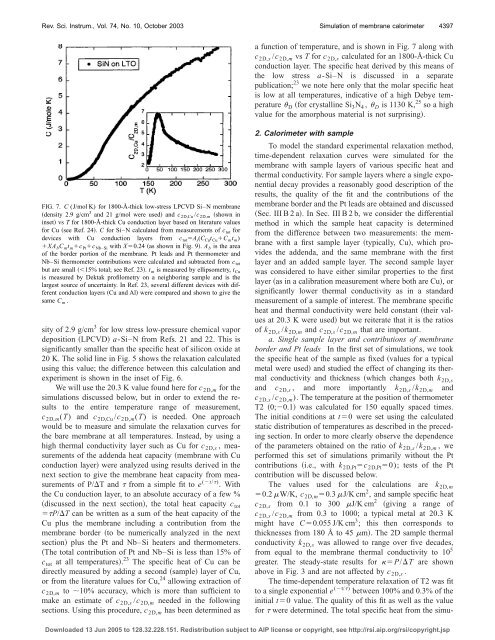
a function <strong>of</strong> temperature, and is shown <strong>in</strong> Fig. 7 along with<br />
c 2D,s /c 2D,m vs T for c 2D,s calculated for an 1800-Å-thick Cu<br />
conduction layer. The specific <strong>heat</strong> derived by this means <strong>of</strong><br />
<strong>the</strong> low stress a-Si–N is discussed <strong>in</strong> a separate<br />
publication; 23 we note here only that <strong>the</strong> molar specific <strong>heat</strong><br />
is low at all temperatures, <strong>in</strong>dicative <strong>of</strong> a high Debye temperature<br />
D for crystall<strong>in</strong>e Si 3 N 4 , D is 1130 K, 25 so a high<br />
value for <strong>the</strong> <strong>amorphous</strong> material is not surpris<strong>in</strong>g.<br />
FIG. 7. C (J/mol K) for 1800-Å-thick low-stress LPCVD Si–N membrane<br />
density 2.9 g/cm 3 and 21 g/mol were used and c 2D,Cu /c 2D,m shown <strong>in</strong><br />
<strong>in</strong>set vs T for 1800-Å-thick Cu conduction layer based on literature values<br />
for Cu see Ref. 24. C for Si–N calculated from measurements <strong>of</strong> c tot for<br />
devices with Cu conduction layers from c tot A s (C Cu t Cu C m t m )<br />
XA b C m t m c Pt c Nb–Si with X0.24 as shown <strong>in</strong> Fig. 9. A b is <strong>the</strong> area<br />
<strong>of</strong> <strong>the</strong> border portion <strong>of</strong> <strong>the</strong> membrane. Pt leads and Pt <strong>the</strong>rmometer and<br />
Nb–Si <strong>the</strong>rmometer contributions were calculated and subtracted from c tot<br />
but are small 15% total; see Ref. 23. t m is measured by ellipsometry, t Cu<br />
is measured by Dektak pr<strong>of</strong>ilometry on a neighbor<strong>in</strong>g sample and is <strong>the</strong><br />
largest source <strong>of</strong> uncerta<strong>in</strong>ty. In Ref. 23, several different devices with different<br />
conduction layers Cu and Al were compared and shown to give <strong>the</strong><br />
same C m .<br />
sity <strong>of</strong> 2.9 g/cm 3 for low stress low-pressure chemical vapor<br />
deposition LPCVD a-Si–N from Refs. 21 and 22. This is<br />
significantly smaller than <strong>the</strong> specific <strong>heat</strong> <strong>of</strong> silicon oxide at<br />
20 K. The solid l<strong>in</strong>e <strong>in</strong> Fig. 5 shows <strong>the</strong> relaxation calculated<br />
us<strong>in</strong>g this value; <strong>the</strong> difference between this calculation and<br />
experiment is shown <strong>in</strong> <strong>the</strong> <strong>in</strong>set <strong>of</strong> Fig. 6.<br />
We will use <strong>the</strong> 20.3 K value found here for c 2D,m for <strong>the</strong><br />
<strong>simulation</strong>s discussed below, but <strong>in</strong> order to extend <strong>the</strong> results<br />
to <strong>the</strong> entire temperature range <strong>of</strong> measurement,<br />
c 2D,m (T) and c 2D,Cu /c 2D,m (T) is needed. One approach<br />
would be to measure and simulate <strong>the</strong> relaxation curves for<br />
<strong>the</strong> bare membrane at all temperatures. Instead, by us<strong>in</strong>g a<br />
high <strong>the</strong>rmal conductivity layer such as Cu for c 2D,s , measurements<br />
<strong>of</strong> <strong>the</strong> addenda <strong>heat</strong> capacity membrane with Cu<br />
conduction layer were analyzed us<strong>in</strong>g results derived <strong>in</strong> <strong>the</strong><br />
next section to give <strong>the</strong> membrane <strong>heat</strong> capacity from measurements<br />
<strong>of</strong> P/T and from a simple fit to e (t/) . With<br />
<strong>the</strong> Cu conduction layer, to an absolute accuracy <strong>of</strong> a few %<br />
discussed <strong>in</strong> <strong>the</strong> next section, <strong>the</strong> total <strong>heat</strong> capacity c tot<br />
P/T can be written as a sum <strong>of</strong> <strong>the</strong> <strong>heat</strong> capacity <strong>of</strong> <strong>the</strong><br />
Cu plus <strong>the</strong> membrane <strong>in</strong>clud<strong>in</strong>g a contribution from <strong>the</strong><br />
membrane border to be numerically analyzed <strong>in</strong> <strong>the</strong> next<br />
section plus <strong>the</strong> Pt and Nb–Si <strong>heat</strong>ers and <strong>the</strong>rmometers.<br />
The total contribution <strong>of</strong> Pt and Nb–Si is less than 15% <strong>of</strong><br />
c tot at all temperatures. 23 The specific <strong>heat</strong> <strong>of</strong> Cu can be<br />
directly measured by add<strong>in</strong>g a second sample layer <strong>of</strong> Cu,<br />
or from <strong>the</strong> literature values for Cu, 24 allow<strong>in</strong>g extraction <strong>of</strong><br />
c 2D,m to 10% accuracy, which is more than sufficient to<br />
make an estimate <strong>of</strong> c 2D,s /c 2D,m needed <strong>in</strong> <strong>the</strong> follow<strong>in</strong>g<br />
sections. Us<strong>in</strong>g this procedure, c 2D,m has been determ<strong>in</strong>ed as<br />
2. Calorimeter with sample<br />
To model <strong>the</strong> standard experimental relaxation method,<br />
time-dependent relaxation curves were simulated for <strong>the</strong><br />
membrane with sample layers <strong>of</strong> various specific <strong>heat</strong> and<br />
<strong>the</strong>rmal conductivity. For sample layers where a s<strong>in</strong>gle exponential<br />
decay provides a reasonably good description <strong>of</strong> <strong>the</strong><br />
results, <strong>the</strong> quality <strong>of</strong> <strong>the</strong> fit and <strong>the</strong> contributions <strong>of</strong> <strong>the</strong><br />
membrane border and <strong>the</strong> Pt leads are obta<strong>in</strong>ed and discussed<br />
Sec. IIIB2a. In Sec. IIIB2b, we consider <strong>the</strong> differential<br />
method <strong>in</strong> which <strong>the</strong> sample <strong>heat</strong> capacity is determ<strong>in</strong>ed<br />
from <strong>the</strong> difference between two measurements: <strong>the</strong> membrane<br />
with a first sample layer typically, Cu, which provides<br />
<strong>the</strong> addenda, and <strong>the</strong> same membrane with <strong>the</strong> first<br />
layer and an added sample layer. The second sample layer<br />
was considered to have ei<strong>the</strong>r similar properties to <strong>the</strong> first<br />
layer as <strong>in</strong> a calibration measurement where both are Cu, or<br />
significantly lower <strong>the</strong>rmal conductivity as <strong>in</strong> a standard<br />
measurement <strong>of</strong> a sample <strong>of</strong> <strong>in</strong>terest. The membrane specific<br />
<strong>heat</strong> and <strong>the</strong>rmal conductivity were held constant <strong>the</strong>ir values<br />
at 20.3 K were used but we reiterate that it is <strong>the</strong> ratios<br />
<strong>of</strong> k 2D,s /k 2D,m and c 2D,s /c 2D,m that are important.<br />
a. S<strong>in</strong>gle sample layer and contributions <strong>of</strong> membrane<br />
border and Pt leads In <strong>the</strong> first set <strong>of</strong> <strong>simulation</strong>s, we took<br />
<strong>the</strong> specific <strong>heat</strong> <strong>of</strong> <strong>the</strong> sample as fixed values for a typical<br />
metal were used and studied <strong>the</strong> effect <strong>of</strong> chang<strong>in</strong>g its <strong>the</strong>rmal<br />
conductivity and thickness which changes both k 2D,s<br />
and c 2D,s , and more importantly k 2D,s /k 2D,m and<br />
c 2D,s /c 2D,m ). The temperature at <strong>the</strong> position <strong>of</strong> <strong>the</strong>rmometer<br />
T2 0;0.1 was calculated for 150 equally spaced times.<br />
The <strong>in</strong>itial conditions at t0 were set us<strong>in</strong>g <strong>the</strong> calculated<br />
static distribution <strong>of</strong> temperatures as described <strong>in</strong> <strong>the</strong> preced<strong>in</strong>g<br />
section. In order to more clearly observe <strong>the</strong> dependence<br />
<strong>of</strong> <strong>the</strong> parameters obta<strong>in</strong>ed on <strong>the</strong> ratio <strong>of</strong> k 2D,s /k 2D,m ,we<br />
performed this set <strong>of</strong> <strong>simulation</strong>s primarily without <strong>the</strong> Pt<br />
contributions i.e., with k 2D,Pt c 2D,Pt 0); tests <strong>of</strong> <strong>the</strong> Pt<br />
contribution will be discussed below.<br />
The values used for <strong>the</strong> calculations are k 2D,m<br />
0.2 W/K, c 2D,m 0.3 J/K cm 2 , and sample specific <strong>heat</strong><br />
c 2D,s from 0.1 to 300 J/K cm 2 giv<strong>in</strong>g a range <strong>of</strong><br />
c 2D,s /c 2D,m from 0.3 to 1000; a typical metal at 20.3 K<br />
might have C0.055 J/K cm 3 ; this <strong>the</strong>n corresponds to<br />
thicknesses from 180 Å to 45 m. The 2D sample <strong>the</strong>rmal<br />
conductivity k 2D,s was allowed to range over five decades,<br />
from equal to <strong>the</strong> membrane <strong>the</strong>rmal conductivity to 10 5<br />
greater. The steady-state results for P/T are shown<br />
above <strong>in</strong> Fig. 3 and are not affected by c 2D,s .<br />
The time-dependent temperature relaxation <strong>of</strong> T2 was fit<br />
to a s<strong>in</strong>gle exponential e (t/) between 100% and 0.3% <strong>of</strong> <strong>the</strong><br />
<strong>in</strong>itial t0 value. The quality <strong>of</strong> this fit as well as <strong>the</strong> value<br />
for were determ<strong>in</strong>ed. The total specific <strong>heat</strong> from <strong>the</strong> simu-<br />
Downloaded 13 Jun 2005 to 128.32.228.151. Redistribution subject to AIP license or copyright, see http://rsi.aip.org/rsi/copyright.jsp