Phys. Rev. Lett. 90, 177402 - Physik-Institut
Phys. Rev. Lett. 90, 177402 - Physik-Institut
Phys. Rev. Lett. 90, 177402 - Physik-Institut

You also want an ePaper? Increase the reach of your titles
YUMPU automatically turns print PDFs into web optimized ePapers that Google loves.
VOLUME <strong>90</strong>, NUMBER 17<br />
(a)<br />
(b)<br />
p // - p⊥ DOS (states/eV)<br />
p // - p⊥ LDOS (states/eV)<br />
0.08<br />
0.04<br />
0.00<br />
-0.04<br />
0.002<br />
0.000<br />
-0.002<br />
d → p<br />
8 4 0 -4<br />
E B (eV)<br />
1 2 3 4 5 6 7 8 9 10<br />
Layer # (n)<br />
p → s<br />
Cu(112)<br />
Cu(331)<br />
Cu(112)<br />
Cu(331)<br />
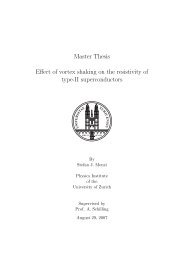
FIG. 3. (a) Total anisotropy of the partial local density of<br />
states (p k p ? ) for the top ten layers of Cu(112) and Cu(331).<br />
The inset zooms into the spectrum where the p ! s (4.3 eV)<br />
and the d ! p (2 eV) interband transitions occur [26].<br />
(b) Layer resolved anisotropy of the p LDOS at a binding<br />
energy of 1 eV. The layers are numbered along the vicinal<br />
planes, starting from the outermost step atom (n 1).<br />
Layer 3 corresponds to the corner atoms.<br />
an opposite anisotropy for the A-andB-type vicinals, just<br />
as in the experimental reflectivity curves at 4.3 eV photon<br />
energy, shown in Fig. 2 and the sign of p k p ? agrees<br />
with the experimental reflectance anisotropy.<br />
In order to identify the corner atoms as the main contribution<br />
to the 4.3 eV anisotropy difference, we plot in<br />
Fig. 3(b) the p k p ? LDOS, at a binding energy of<br />
1eV for the different layers (atoms) n on the two<br />
vicinals. Indeed, the difference in the anisotropy has its<br />
largest contribution from the corner atoms of the A- and<br />
B-type steps (n 3). Figure 3(b) is also indicative of the<br />
degree of localization of the anisotropy. It decays exponentially<br />
away from the corner atoms and the screening<br />
length is of the order of the Fermi wavelength (4:6 A for<br />
copper).<br />
The assignment to a local origin (corner atoms) of the<br />
4.3 eV reflectance anisotropy is further corroborated by<br />
PHYSICAL REVIEW LETTERS week ending<br />
2 MAY 2003<br />
E F<br />
x 3<br />
the analysis of Cu(332) and Cu(443), i.e., two more<br />
B-type surfaces with different step densities. Figure 4<br />
shows that the anisotropy of the peak at 4.3 eV is roughly<br />
proportional to the step density 1=‘, where ‘ is the step<br />
separation length. The proportionality factor is about<br />
7:5 0:8 10 3 ‘ o , where ‘ 3 o is the atomic volume.<br />
With a penetration depth of 80‘ o for 4.3 eV photons into<br />
copper we see that the observed anisotropy may have a<br />
local origin, i.e., have its source in single atomic objects<br />
on the surface. The proportionality factor for the measured<br />
A type has opposite sign, though the same order of<br />
magnitude. The sensitivity for the reflection anisotropy in<br />
the current setup is estimated to 0:5 10 3 [27] and<br />
translates for a given orientation on vicinal copper into a<br />
step density 1=‘ of 10 6 steps=cm or a step atom density<br />
1=‘‘ o of 5 10 13 step atoms=cm 2 .<br />
Besides the previously discussed 4.3 eV feature, the<br />
reflectance anisotropy spectra contain a signature at<br />
2eV which does not change sign between A- and<br />
B-type vicinals but is in intensity proportional to the<br />
step density, too. In contrast to Cu(110) where at this<br />
energy a resonance of the highly anisotropic Shockley<br />
surface state with an unoccupied surface state occurs [18],<br />
no influence of the Shockley surface state was found.<br />
Experiments where the surfaces were exposed to oxygen<br />
and ambient air showed the reflectance anisotropy spectra<br />
to be susceptible to oxidation, though in the whole observed<br />
photon energy range no spectral feature could be<br />
assigned to the disappearance of the Shockley surface<br />
state. However, distinct signatures from the A and B types<br />
that reconstruct differently under oxygen exposure<br />
[28,29] persist and give further evidence for the usefulness<br />
of RAS. If, however, the above theoretical analysis is<br />
performed for optical excitations at 2eV, i.e., the<br />
d ! p transitions, we find in this case the step atoms<br />
(n 1) to contribute the main anisotropy in the relevant<br />
unoccupied p states above the Fermi level [26]. The<br />
anisotropies have the same sign and magnitude for A<br />
and B types and are in line with the same coordination<br />
for A- andB-type step atoms [30].<br />
From the trace back of the optical anisotropies to<br />
differently coordinated atoms we conjecture that such<br />
step signatures should be generally found on stepped<br />
surfaces. On a given vicinal fcc(111) surface the two<br />
different anisotropies from the corner and the step atoms<br />
provide the unique opportunity to determine the nature,<br />
orientation, and concentration of steps by recording<br />
reflectance anisotropy spectra for different azimuthal<br />
angles of the polarization planes of the incoming light.<br />
In summary it is shown that RAS provides information<br />
from which it is possible to recognize very low<br />
densities of differently coordinated atoms on surfaces.<br />
Furthermore, ab initio electronic structure calculations<br />
are able to identify the local characteristics that distinguish<br />
the atoms in low coordinated sites on stepped<br />
surfaces. These results open the way for detailed<br />
<strong>177402</strong>-3 <strong>177402</strong>-3